Figure 1.
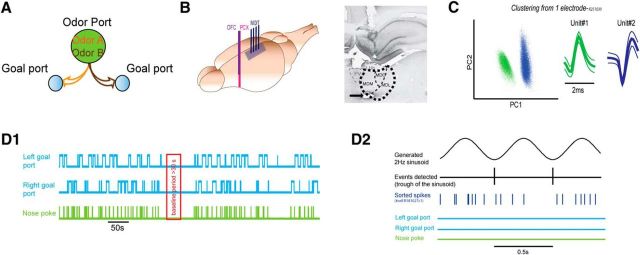
Design of the task and baseline. A, Schematic representation of the two-alternative odor discrimination task. B, Left, Design of the implantation. Tetrodes were aimed at the MDT and two LFP electrodes were aimed at the PCX and OFC. Right, Example of electrode location in the MDT with the cannulae track as well as the electrolytic lesion site (anteroposterior coordinate ∼−2.6 mm). C, Example of spikes-cluster-PCA detection and average spike waveforms on one electrode. D, Baseline period. D1, Baseline period (red) was taken during a quiet awake period >30 s (when the animal was awake but not engaged in the task). D2, During the baseline period (enlarged view), a 2 Hz sinusoid was generated. Each trough of the sinusoid was detected (black). Using the troughs as events, PSTHs of 0.5 s after the troughs were generated for each unit (with sorted spikes in dark blue) during the baseline period.

