Figure 7.
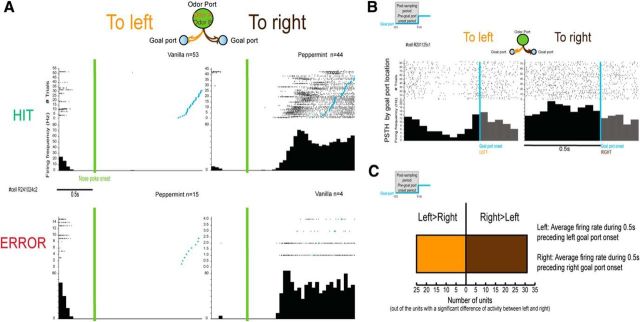
Encoding of goal port location. A, Example of a unit's raster plots and PSTHs as a function of hits (top) and errors (bottom) and the odors used (performance: 84%). Raster plots and PSTHs are triggered by the nose poke onset (green). Blue dots represent the goal port onsets (only trials with the goal port entry within 2 s after the nose poke onset are displayed). B, Example of a unit's raster plots and PSTHs by goal port location. Raster plots and PSTHs are triggered by the goal port onset (blue). This unit presents a significant difference of pregoal port activity between moving to the right or the left goal port (Wilcoxon signed-rank test, p < 0.05). C, Of the units (n = 56/155) with a significant difference of pregoal port activity between left and right goal ports, 55% display an average firing rate superior during the right versus the left pregoal port period.

