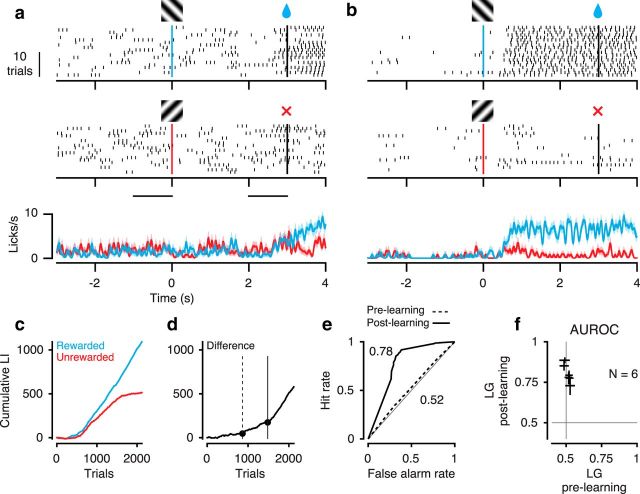
Figure 3.
Orientation discrimination for LGs. a, Example behavioral session, before learning. Top, Licks to the rewarded orientation. Middle, Licks to the unrewarded orientation. Bottom, Trial-averaged lick density. Shaded regions represent mean ± SEM. Gratings indicate stimulus onset. Black vertical lines indicate stimulus offset. Black horizontal lines indicate baseline and stimulus period used for computing the LI. Session 5, b, Same as a, after learning. Session 21, c, Cumulative LI as a function of trial number for rewarded (blue) and unrewarded orientations (red). d, Difference of cumulative LIs between the two orientations. Dots indicate significant change points used for assigning sessions to training stages. Trials before the first change point were assigned to the prelearning stage (dashed vertical line). Trials after the last change point (solid vertical line) were assigned to the postlearning stage. e, ROC analysis based on distributions of LIs from the two conditions in the prelearning stage (dashed curve) and postlearning stage (solid curve). a–e, Example mouse 278. f, AUROC across mice (N = 6). Crosses represent 95% CIs.

