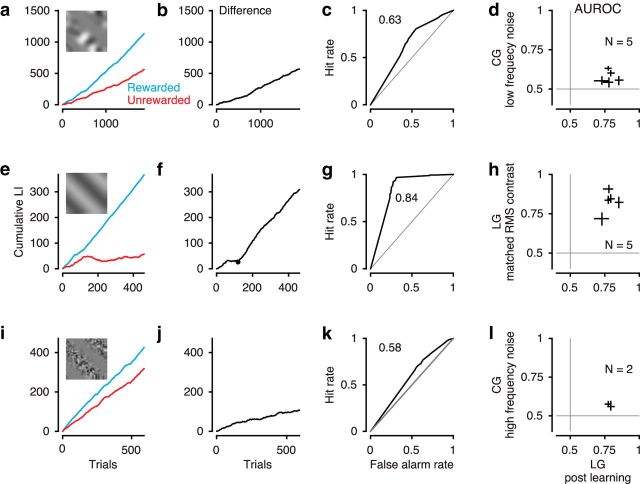
Figure 4.
Behavioral performance for CGs and control conditions. a–d, Performance for CGs with low-frequency noise carrier. a, Cumulative LI as a function of trial. Blue represents rewarded orientation. Red represents unrewarded orientation. b, Difference of cumulative LI between the two orientations. c, ROC analysis based on LIs. a–c, Example mouse 278. d, Comparison of AUROC values for LGs (after learning; Fig. 3f) and CGs (N = 5 mice). Crosses represent 95% CI. e–h, Same as a–d, for performance for LGs matched in RMS contrast. g, We only considered data with stable performance (i.e., trials after the first change point in f). i–l, Same as a–d, for performance for CGs with high-frequency noise carrier (N = 2 mice). Conventions as in Figure 3.

