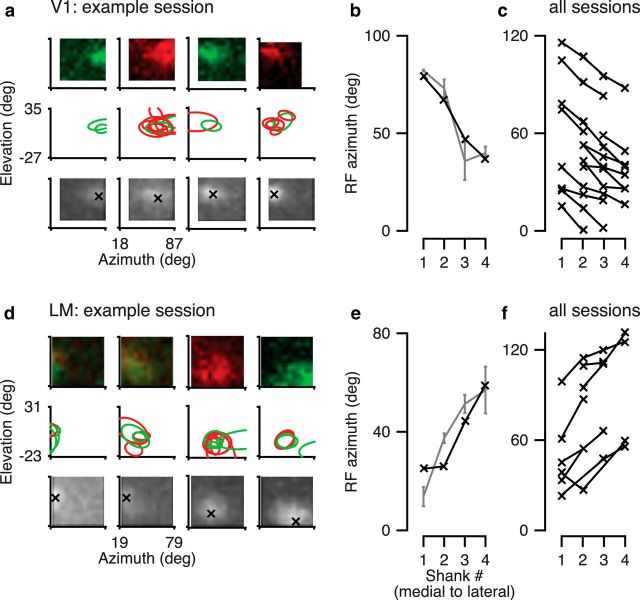
Figure 5.
Identification of visual areas V1 and LM by mirrored retinotopic progression of azimuth. a, Top, Example single-unit RF maps in area V1 for each electrode shank in one example session. Red represents ON field. Green represents OFF field. Units 291-2-x.17, 46, 62, 76. Middle, Contours of all well-fitted RFs in this example session. Bottom, RF maps based on multiunit activity for this example session. b, RF azimuth in the example session based on average single-unit RF centers (gray) and multiunit activity (black). c, Summary of RF azimuth across all V1 recordings. N = 14 sessions. d–f, Same as a–c, for area LM. Units 241-4-x.47, 67, 70, 84. f, N = 8 sessions.

