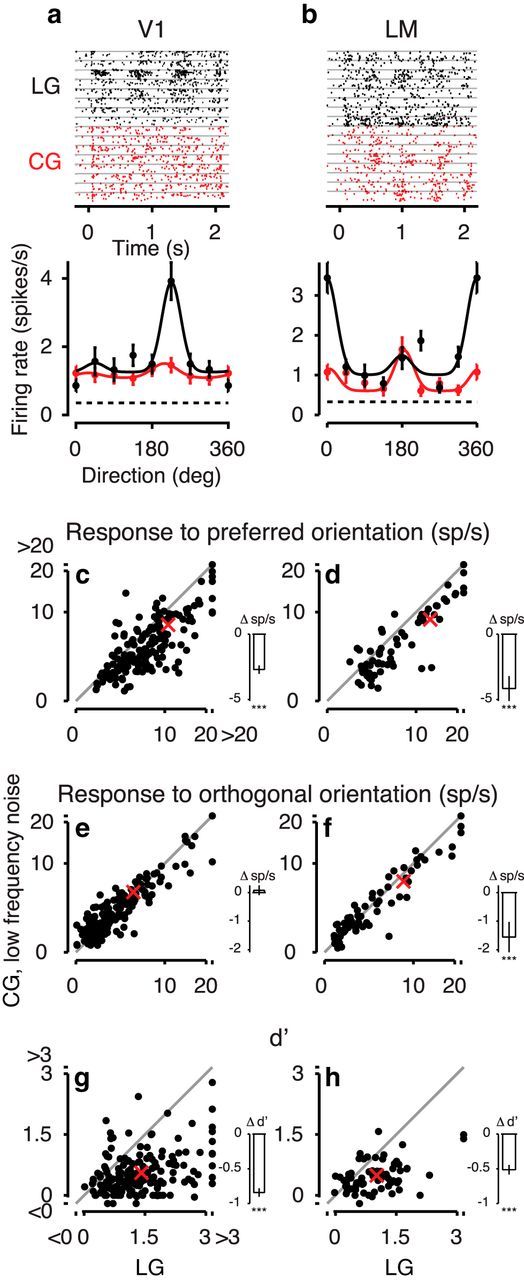
Figure 7.

Responses to CGs with low-frequency noise carriers in mouse visual cortex. a, Responses to LGs (black) and CGs (red) of an example neuron from area V1. Top, Raster plots. Bottom, Tuning curves of the same example neuron (Unit 221-1-7.61). b, Same, for an LM example neuron (Unit 245-4-6.35). c, d, Response to the preferred orientation for CGs versus LGs in the population of responsive neurons recorded from V1, N = 178 (c) and LM, N = 69 (d). Insets, Mean pairwise differences and their SEM (Franz and Loftus, 2012). Stars represent significance of post hoc comparisons. e, f, Same as c, d, for response to orthogonal orientation. g, h, Same as c, d, for d′. Red crosses represent means. Conventions as in Figure 6.
