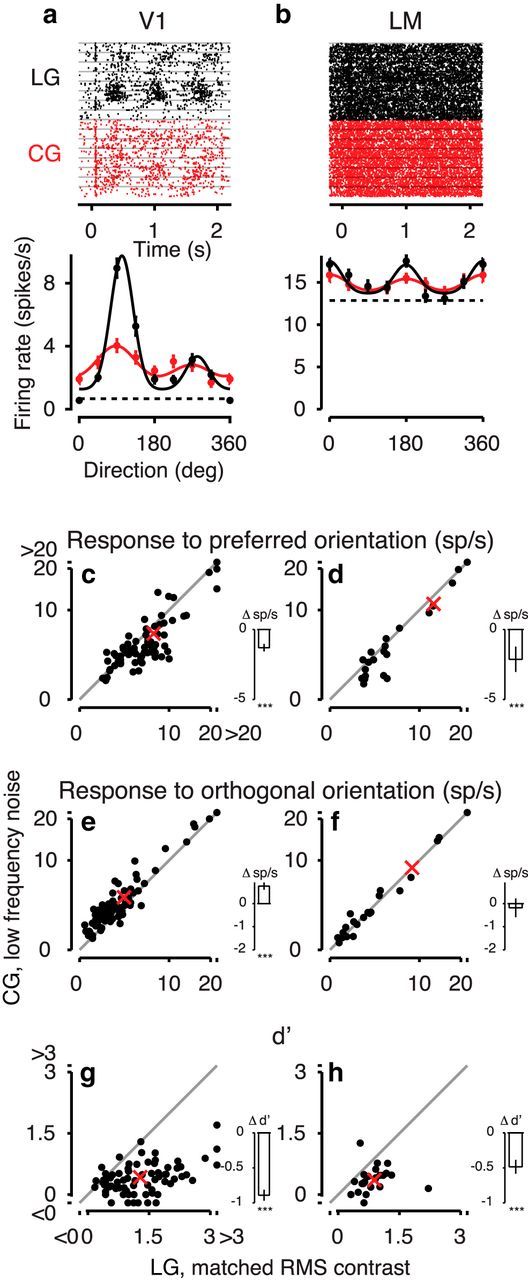
Figure 8.

Comparison of responses to LGs matched in RMS contrast and CGs. a, Responses to LGs with matched RMS contrast (black) and CGs with low-frequency noise (red) of an example neuron from area V1. Top, Raster plot. Bottom, Tuning curves of the same example neuron (Unit 221-1-6.24). b, Same, for an LM example neuron (Unit 245-5-7.17). c, d, Responses to preferred orientations for CGs versus LGs with matched RMS contrast in the population of (c) V1 neurons, N = 73 and (d) LM neurons, N = 23. e, f, Same as c, d, for responses to orthogonal orientations. g, h, Same as c, d, for d′. Conventions as in Figure 7.
