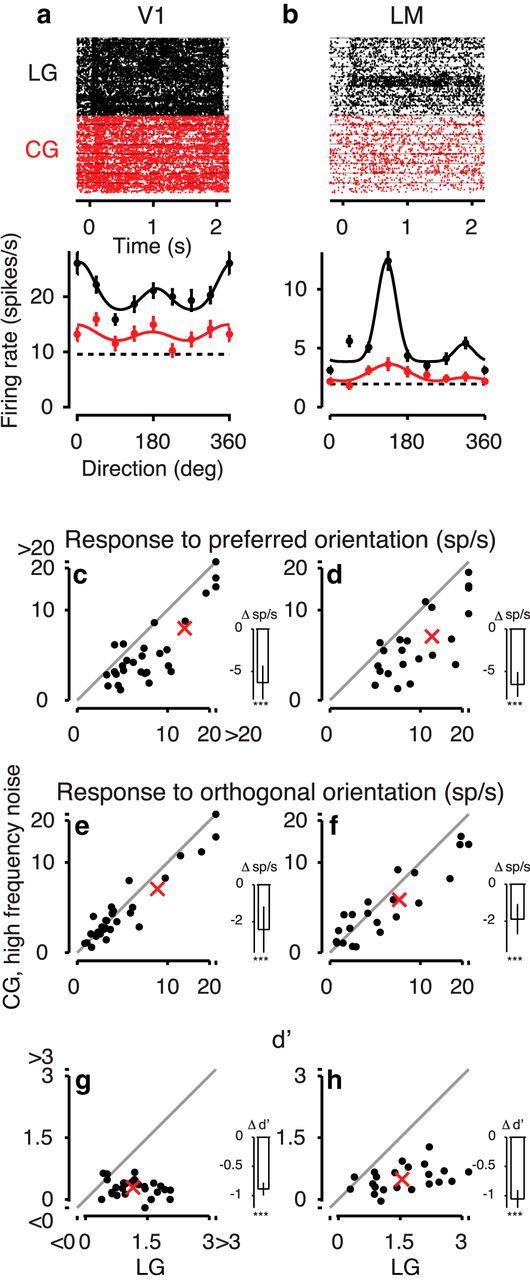
Figure 9.

Responses to CGs with high-frequency noise carrier. a, Responses to LGs (black) and CGs with high-frequency noise (red) of a V1 example neuron. Top, Raster plots. Bottom, Tuning curves of the same example neurons (Unit 326-1-2.48). b, Same for an LM example neuron (Unit 299-3-13.42). c, d, Responses to preferred orientations for CGs with high-frequency noise versus LGs in the population of V1 neurons, N = 29 (c) and LM neurons, N = 22, (d). e, f, Same as c, d, for responses to orthogonal orientations. g, h, Same as c, d, for d′. For other conventions, see Figure 7.
