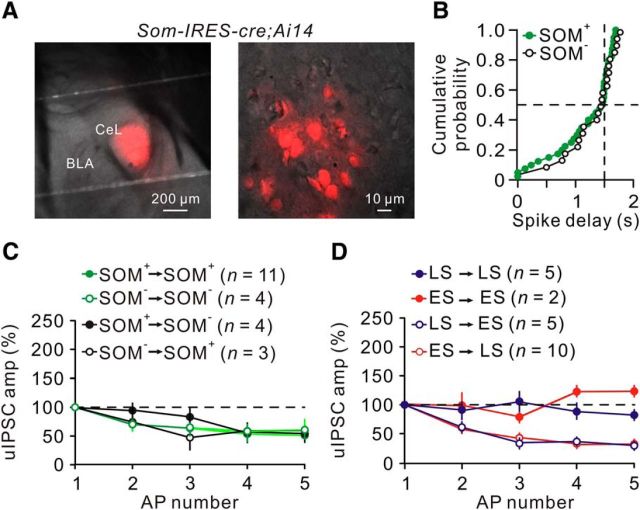
Figure 9.
Cell-type-specific transmission was independent of SOM expression in presynaptic and postsynaptic neurons. A, Section from the brain of a Som-IRES-cre;Ai14 mouse. Left, Overlay of epifluorescence and IR-DIC images showing CeL with abundant red fluorescence. Right, Enlargement of CeL; SOM+ cells were visible (red) under epifluorescence. B, Cumulative distributions of spike delays from SOM+ and SOM− cells; the horizontal dashed line indicates the cumulative probability at 1.5 s spike delay in SOM+ and SOM− groups. C, Left, Average amplitudes normalized to the amplitude of the uIPSC1 for each type of connections using SOM as a cell-type marker. D, Plot of normalized uIPSC amplitude versus AP number. Neurons in C and D are classified based on their firing patterns.

