
Figure 8.
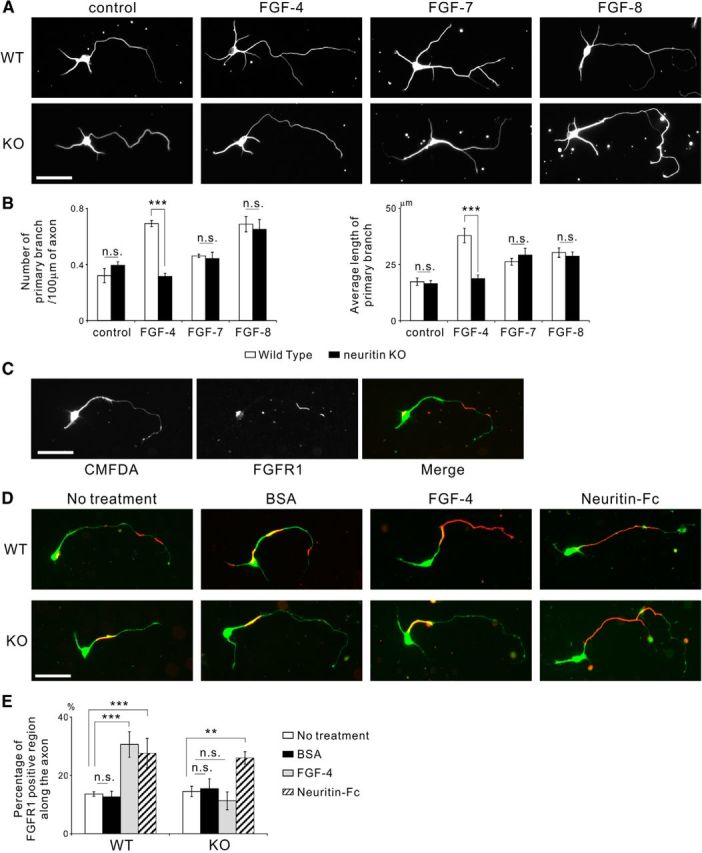
The FGF-4/5/6 subfamily is involved in neuritin-mediated axonal branching. In addition, neuritin and FGF-4/5/6 aid the recruitment of FGFR1 to the cell surface. A, FGF-4 failed to promote axonal branching in neurons from neuritin KO mice, whereas FGF-7 and FGF-8 had a branching effect on neurons from both WT and KO mice. Neurons were cultured with 2 nm recombinant FGF from DIV 2 to DIV 4. Representative neurons are shown. Scale bar, 50 μm. B, Quantification of the number of primary branches per 100 μm of axon (control: p = 0.307; FGF-4: p < 0.001; FGF-7: p = 0.818; and FGF-8: p = 0.704) and the average length of primary branches (control: p = 0.801; FGF-4: p < 0.001; FGF-7: p = 0.578; and FGF-8: p = 0.661) from three independently performed experiments; n = 30 for each. ***p < 0.005 (one-way ANOVA for each FGF). n.s., Not significant. C, FGFR1 localized to parts of the cell surface along the neurite and on the cell body. The cultured mouse granule neurons were treated with 30 μm CMFDA for 3 h before fixation at DIV 4 and were immunostained without permeabilization. CMFDA treatment visualized the whole-cell body and neurites. FGFR1 unevenly localized on the cell surface. Scale bar, 50 μm. D, FGF-4 failed to recruit FGFR1 to the axonal surface in the neurons from neuritin KO mice, whereas Neuritin-Fc increased cell surface FGFR1 along the axon in the neurons from both WT and KO mice. Neurons were cultured with 30 μm CMFDA for 3 h and 2 nm of FGF-4 or 1 μg/ml of Neuritin-Fc for 15 min before fixation at DIV 4; they were immunostained without permeabilization. Representative neurons with CMFDA (green) and cell surface FGFR1 (red) are shown. Scale bar, 50 μm. E, Quantification of the ratio of FGFR1-positive region along the axonal surface (no treatment vs each treatment, in WT, BSA: p = 0.995; FGF-4: p < 0.001; and Neuritin-Fc: p = 0.004; in KO, BSA: p = 0.993; FGF-4: p = 0.815; and Neuritin-Fc: p = 0.010). **p < 0.01, compared with no treatment (one-way ANOVA for each genotype followed by Tukey's post-test). ***p < 0.005, compared with no treatment (one-way ANOVA for each genotype followed by Tukey's post-test).