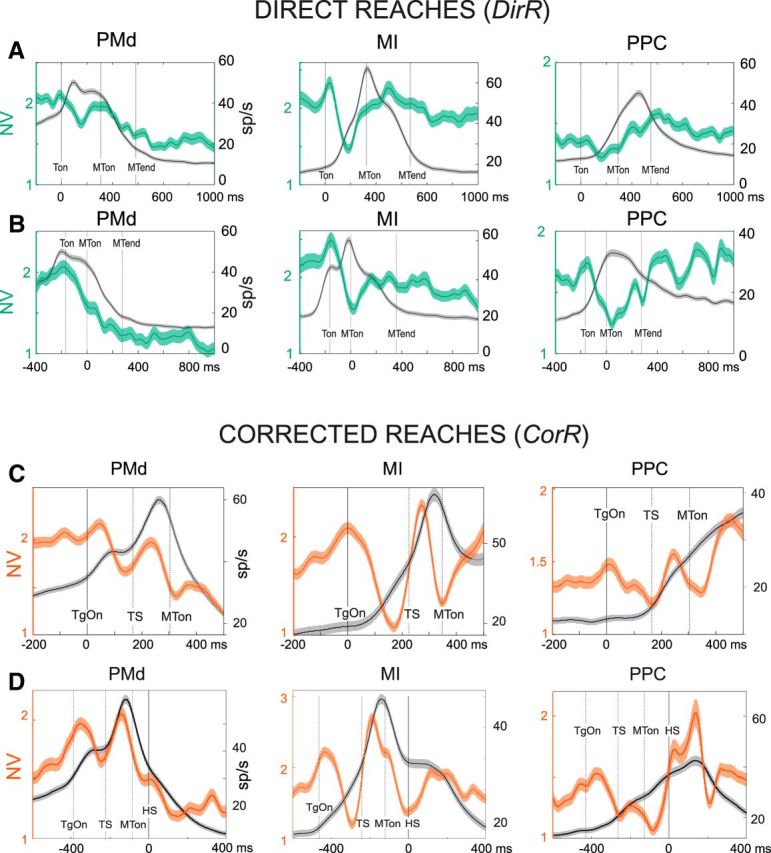
Figure 3.

Time course of neural variability during DirR and CorR conditions across areas. Shown are NV (green/red curve) ± SE and superimposed population spike density function ± SE (SDF, gray) from neural activity recorded during DirR trials (A, B) and CorR trials (C, D) aligned to target presentation (A, C), to movement onset (B), and to time of switch of hand movement direction (D). In all graphs, the primary y-axis (left) refers to the measure of NV and the secondary y-axis (right) refers to SDF (sp/s). Solid vertical lines indicate time of alignment (0 ms); dotted lines refer to mean values of temporal events. NV and SE are computed across number of cells and directions (see Materials and Methods).
