
Figure 4.
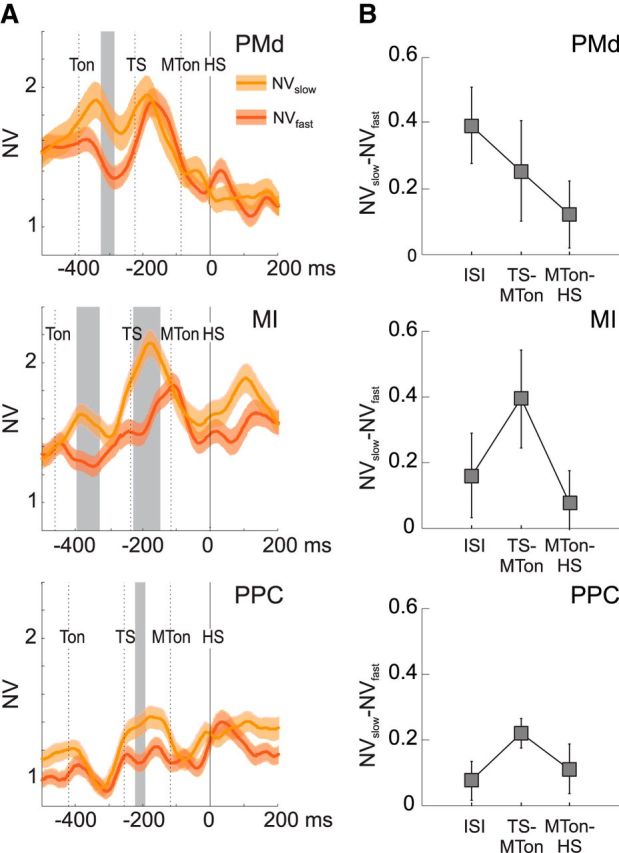
Neural variability associated with slow and fast corrections. A, Comparison of NV (mean ± SE) computed for fast (NVfast; red) and slow (NVslow; orange) corrective movements. Fast/slow corrective trials are defined as those with a short/long time of hand switch (see Materials and Methods). Time intervals with significant differences between NVslow(t) and NVfast(t) (t test; p < 0.05) are reported in gray shading. The analysis is performed on sets of cells (41 in PMd, 54 in MI, 42 in PPC) selected on the basis of their directional modulation in the CorR task (see Materials and Methods); mean and SE are computed across cells. The temporal axis is aligned to the time of switch of hand trajectory (HS; 0 ms). The dashed vertical lines indicate the mean times (across all recording sessions) relative to Ton, TS, and MTon. B, Mean values (± SD) of the differences NVslow(t) − NVfast(t), averaged across time bins, in the three consecutive behavioral epochs ISI, TS-MTon, and MTon-HS.