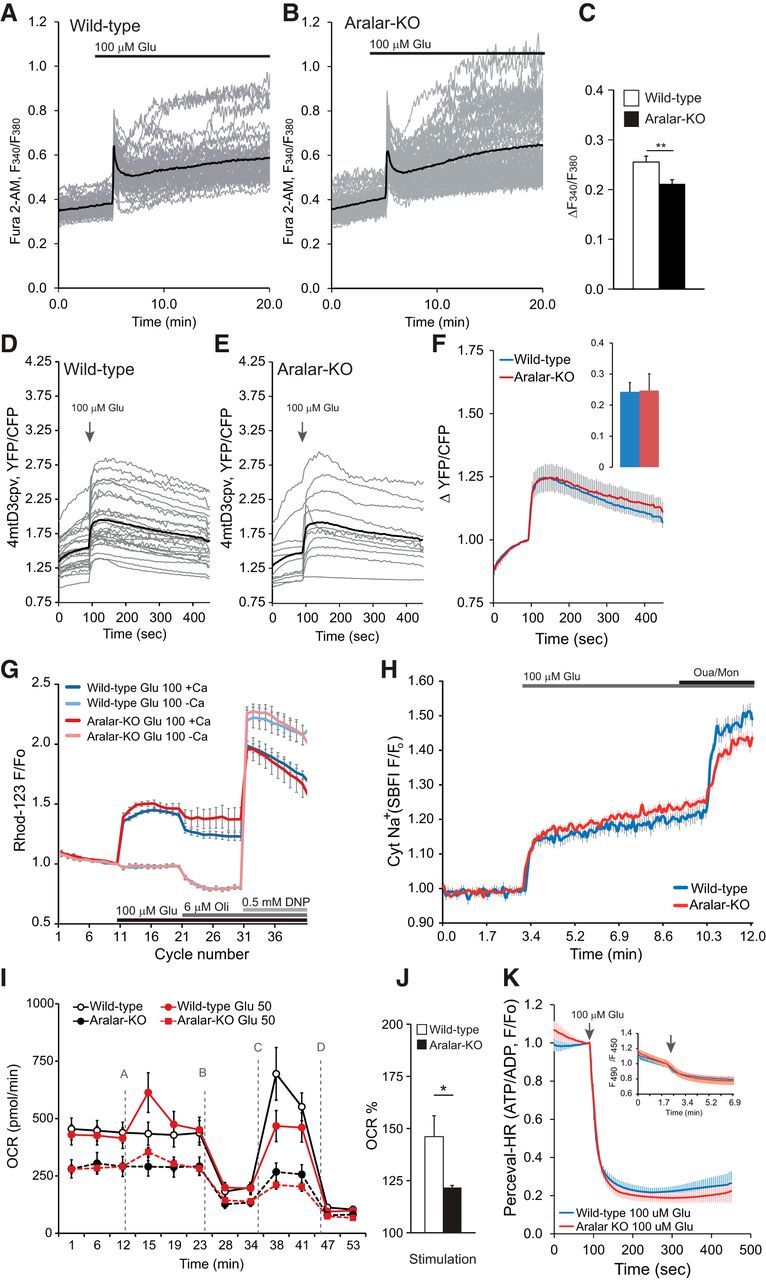
Figure 2.

Stimulation of respiration in response to glutamate is impaired in ARALAR-deficient neurons. A–C, Change in cytosolic Ca2+ in fura-2 AM-loaded neurons obtained by stimulation with 100 μm glutamate (100 μm Glu) in 15 mm glucose and 2 mm Ca2+ media. Fluorescence F340/F380 ratio is represented from >50 neurons from two independent experiments in WT cultures and >70 neurons in four independent experiments in aralar-KO cultures. Individual cell recordings (gray) and average (thick black trace) are shown. D–F, Corresponding data in neurons transfected with 4mtD3cpv probe to determine changes in mitochondrial Ca2+ in 2.5 mm glucose and 2 mm Ca2+ media. Recording from 26 and 11 transfected cells, in 15 and 7 independent experiments, in WT and aralar-KO primary neuronal cultures, respectively. Individual cell recordings (gray) and average (thick black trace) are shown. G, Mitochondrial membrane potential was analyzed using the single-wavelength fluorescent indicator Rhodamine 123 (Rhod-123) in the quench mode. Mitochondrial depolarization is observed as an increase in fluorescence. The 100 μm glutamate in the presence or the absence of 2 mm Ca2+ in 2.5 mm glucose media was added as indicated. Data correspond to ∼10 independent experiments in WT and aralar-KO primary neuronal cultures. Glu, Glutamate; Oli, oligomycin. H, Changes in cytosolic Na+ in SBFI-loaded neurons by stimulation with 100 μm glutamate (100 μm Glu) in 15 mm glucose and 2 mm Ca2+ media. Normalized ratio is represented. Data correspond to 28 neurons from two independent experiments (blue line, WT) and 75 neurons in four independent experiments (red line, aralar-KO), Ouabain (Oua; 0.1 μm), and monensin (Mon; 10 mm) were added for equilibration of extracellular and intracellular [Na+] at the end of the experiments. I, Stimulation of OCR upon 50 μm glutamate (Glu 50) in WT and aralar-KO neurons in 2.5 mm glucose and 2 mm Ca2+ media. A, 50 μm glutamate. B, 6 μm oligomycin. C, 0.5 mm DNP. D, 1 μm/1 μm antimycin/rotenone. n = 33–42 from 11 to 18 independent experiments in WT and n = 25–34 from 9 to 16 aralar-KO primary neuronal cultures. J, Stimulation of respiration (as percentage of basal values). K, Cytosolic ATP/ADP ratio (Perceval-HR occupancy, GFP/Venus ratio fluorescence) was measured in WT and aralar-KO neurons 24 h after Perceval-HR transfection. Neurons were stimulated with 100 μm glutamate in 15 mm glucose and 2 mm Ca2+ medium. Data are mean ± SEM (5–16 neurons and independent platings). Inset, Variations in intracellular pH (mean ± SEM) determined in BCECF-loaded neurons in WT and KO neurons, under the same conditions of the Perceval-HR experiments. *p ≤ 0.05 (Student's t test). **p ≤ 0.01 (Student's t test).
