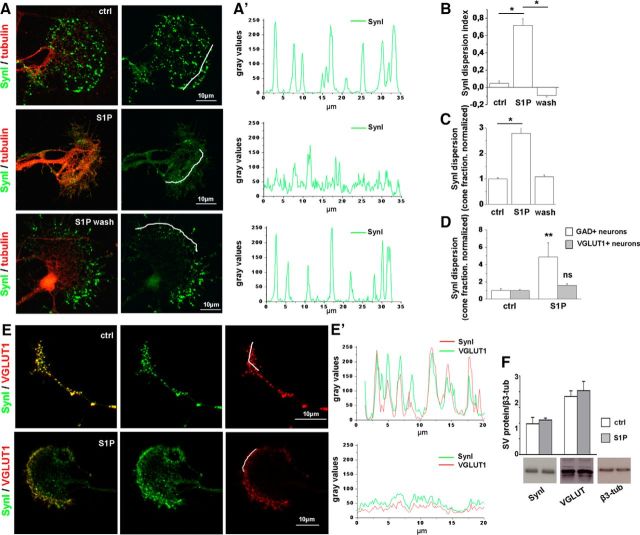
Figure 1.
Low nanomolar S1P induces dispersion of SynI immunoreactivity in growth cones. A, Immunofluorescence of 6 DIV hippocampal neurons treated or not with S1P (50 nm) for 30 min and fixed immediately or 5 h after S1P treatment. Neurons are stained for SynI in green and tubulin in red. SynI is clustered in small puncta in control neurons (top), becomes dispersed after S1P exposure (middle), and reacquires a clustered distribution 5 h after S1P removal (bottom). Scale bar, 10 μm. A′, Fluorescence intensity plot (gray levels) of SynI along lines depicted in A. B, Quantification of SynI dispersion under the different experimental conditions (dispersion index, ctrl = 0.047 ± 0.03026; S1P = 0.7179 ± 0.07696; S1P wash = −0.09127 ± 0.0183, one-way ANOVA p < 0.001, Holm–Sidak's multiple-comparison test). C, Fraction of cones with dispersed SynI under the different experimental conditions (ctrl = 1 ± 0.054; S1P 2.784 ± 0.255; S1P wash = 1.086 ± 0.072, N = 3, Kruskal–Wallis one-way ANOVA p < 0.001, Dunn's multiple-comparison test). D, Fraction of cones with dispersed SynI in control and S1P-treated excitatory or inhibitory hippocampal neurons (VGLUT1+ neurons: ctrl = 1 ± 0.222; S1P = 4.866 ± 1.655; N = 3, Mann–Whitney Rank Sum Test p = 0.008; glutamic acid decarboxylase+ neurons: ctrl = 1 ± 0.108; S1P = 1.586 ± 0.242; N = 3, Mann–Whitney Rank Sum Test p = 0.343). E, E′, Immunofluorescence (E) and plot profiles of fluorescence intensity (E′) showing relocation of SynI and V-GLUT1 at growth cones after exposure to S1P. Peak fluorescence of SynI and VGLUT1 decreases and the intensity profiles of SynI and VGLUT1 fluorescence become more uniformly distributed in S1P-treated neurons. F, Western blotting analysis of developing neurons showing lack of degradation of SynI and VGLUT1 after S1P treatment. β3 tubulin is used as sample loading control. *p < 0.05. **p < 0.01. ns, Not significant.

