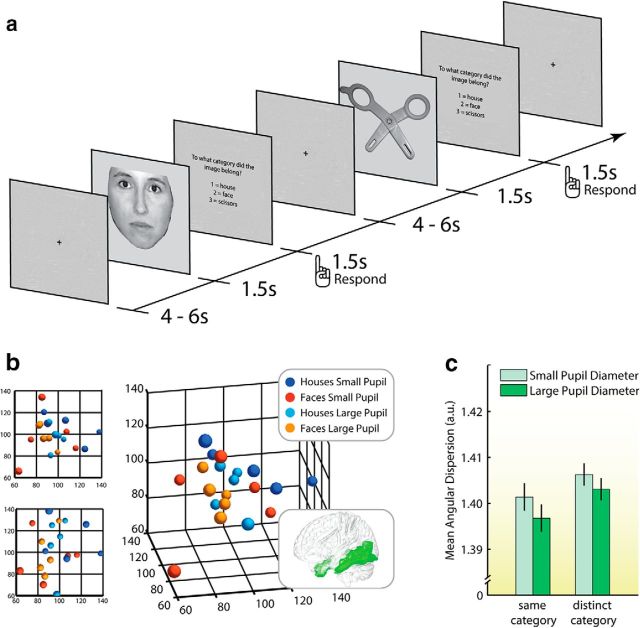
Figure 2.
Trial procedure and empirical results in Study 1. a, Participants categorized three categories of stimuli with a jittered interstimulus interval of 7–9 s. b, Representative sample of data points (colored spheres) with coordinates defined by voxel-activation patterns, scaled down to three dimensions using nonmetric multidimensional scaling. Units on each axis are arbitrary: the three axes define a three-dimensional, representational space. Distance “into” the page is represented with smaller spheres. Angular dispersion characterizes the degree to which points are tightly clustered together (more precise) or loosely spread out (less precise) in the representational space. For both house and face stimuli, the points are closer together in the large-pupil blocks, and across categories large-pupil points are closer together than small-pupil points. These data points were chosen to best illustrate the overall pattern of results. The smaller plots on the left show two-dimensional views of the same data. c, Larger baseline pupil size was associated with lower angular dispersion (higher precision) for both same-category and distinct-category comparisons. Error bars reflect SEM. The glass-brain inset shows the mask of ventral temporal cortex that was employed for all analyses.

