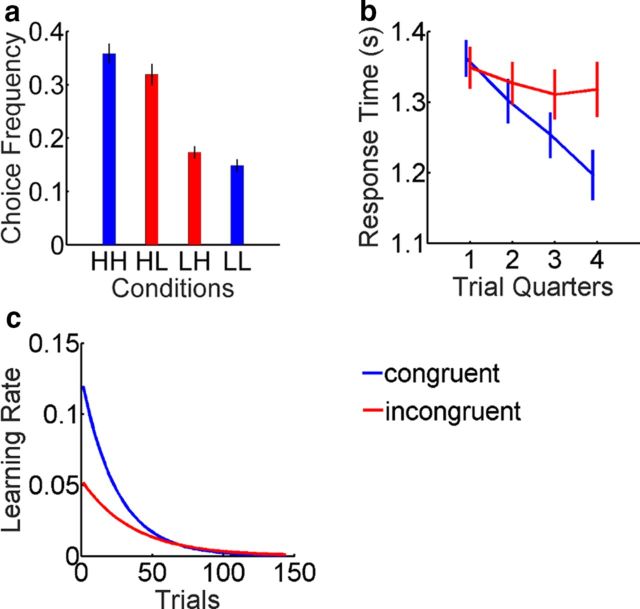
Figure 3.
Analysis of choice behavior. All error bars indicate the SEM. Blue and red colors indicate value congruence and incongruence, respectively. a, Choice probability (average normalized frequency of cue selections) for all cues. b, Mean response time for all subjects split by value congruence across four trial quarters (36 trials each). c, Dynamic LRs for value-congruent and incongruent cues, based on the posterior mean of the group distribution from which individual offset and slope parameters are sampled (for details, see Materials and Methods).

