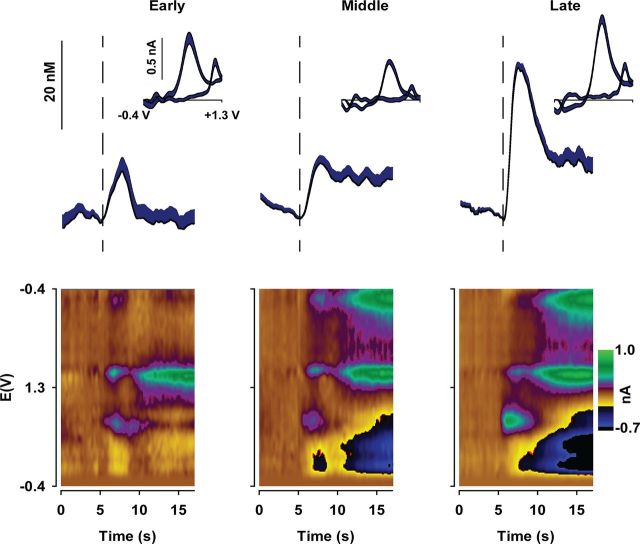
Figure 2.
NAc dopamine release dynamically encodes reward delivery across PR session in WT mice (n = 8). Mean (+SEM) dopamine concentration across all WT mice aligned to reward delivery (vertical dashed line at 5 s) and divided into thirds of the entire session for each animal. Inset, Mean (+SEM) cyclic voltammograms across all WT mice during the peak dopamine concentration following reward delivery. Bottom, Pseudo-color plots of cyclic voltammograms displaying changes in current across the applied potential (E) plotted over time and averaged across all WT mice.

