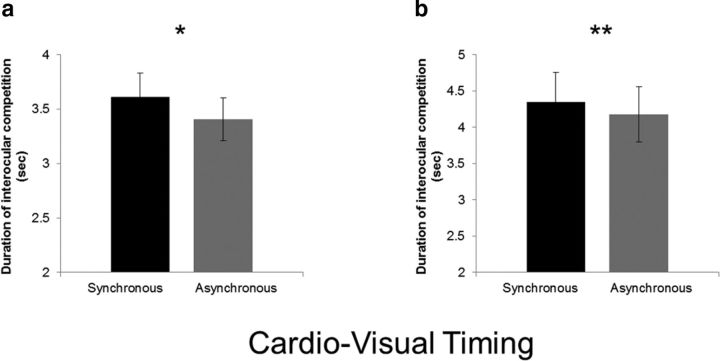
Figure 2.
Suppression of synchronous cardio–visual stimuli compared with asynchronous stimuli. a, Duration of target presentation required for synchronous and asynchronous cardio–visual stimuli to break suppression in Experiment 1 (n = 30). b, Duration of target presentation required for synchronous and asynchronous cardio–visual stimuli to break suppression in Experiment 2 (n = 12). Note that, in both experiments, when the stimuli were synchronous to the heartbeat, they required more presentations to enter consciousness. Error bars indicate SEM (*p < 0.05, **p < 0.01).

