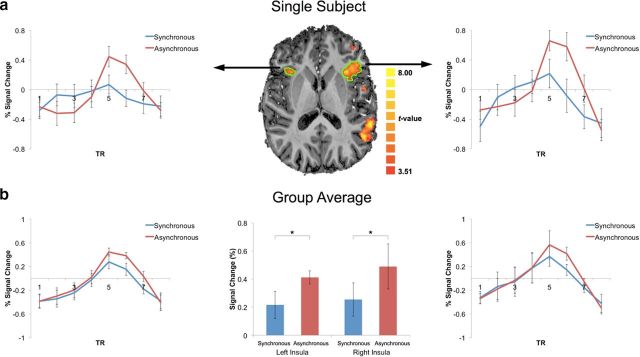
Figure 7.
High-resolution imaging of cardio–visual sensitivity in the anterior insulae during CFS. a, Average BOLD signal response for synchronous (blue) and asynchronous (red) cardio–visual stimuli from left and right anterior insulae of a single subject (outlined in green on axial slices). b, Group average of BOLD time course for synchronous (blue) and asynchronous (red) cardio–visual stimuli from the left and right anterior insulae of all subjects. Middle, Mean of BOLD peak response for group. Error bars indicate SEM (*p < 0.05).

