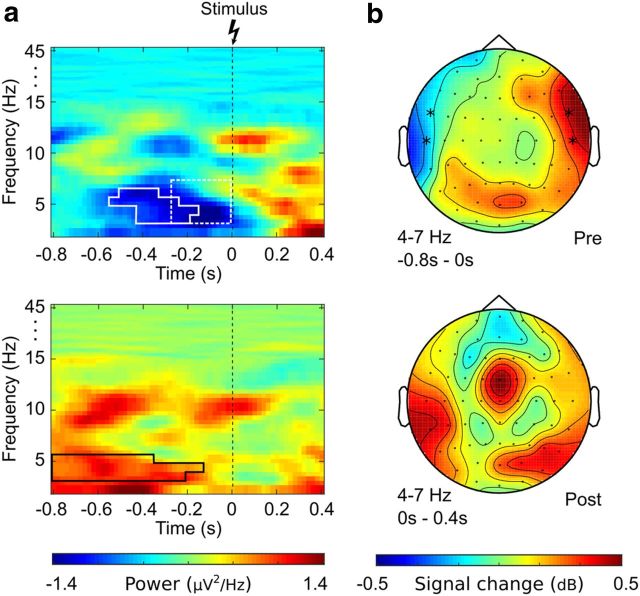
Figure 2.
Power effects in the theta-band (4–7 Hz). a, Time-frequency plot of the difference between pain and no-pain trials averaged across electrodes T7/TF7 (top) and T8/TF8 (bottom). Solid outline indicates the prestimulus effect identified by permutation testing (tmin = −3.06, tmax = 2.77, all p < 0.05, FDR corrected). Dotted outline indicates the data region used as significant regression predictor in single-trial analysis (b = 0.61, p < 0.011). b, The topographies show relative power differences (dB) between pain and no-pain trials in the prestimulus time range (top) and poststimulus time range (bottom). *Electrodes showing significant effects.

