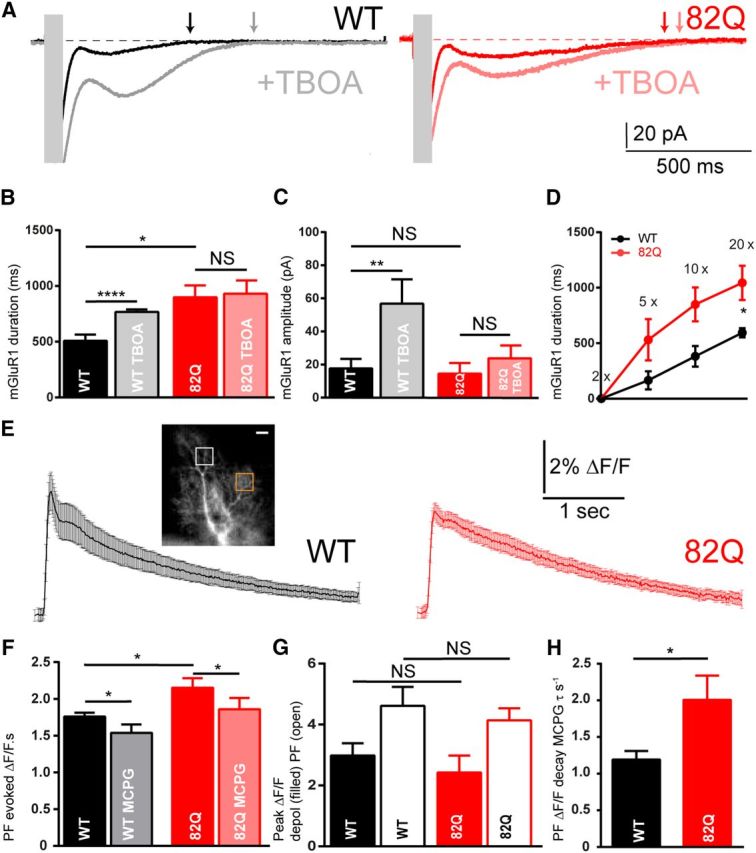
Figure 2.

Prolonged mGluR1 synaptic signaling in 82Q mice. A, Prolonged PF-evoked mGluR1-mediated synaptic currents (10× stimulation, 200 Hz, stimulus artifacts obscured with gray boxes) in PNs from WT and 82Q mice in the presence and absence of TBOA to block glutamate transporters. B, Longer duration mGluR1 current in 82Q PNs versus WT: *F(1,9) = 8.03, p = 0.02, n = 5 each, two-way ANOVA and increased by TBOA in WT PNs but not 82Q PNs; ****p < 0.0001 two-way ANOVA, multiple comparison. C, mGluR1 current peak amplitude is similar between WT and 82Q PNs: F(1,9) = 2.24, p = 0.17, two-way ANOVA and increased by TBOA in WT but less so in 82Q; **p < 0.01 two-way ANOVA. D, Longer mGluR1 currents with increasing stimulation (2×–20×) in 82Q versus WT PNs: *F(1,44) = 21.6, p < 0.0001, n = 9, two-way ANOVA; NS, not significant. E, Mean (and SEM) of Ca2+ signals in PN outer dendrites from WT and 82Q mice following 10× PF stimulation (200 Hz). Inset, An OGB-1 filled PN dendrite (scale bar, 20 μm) with locally responsive dendrite (white box) used to extract fluorescence changes and remote unresponsive area (orange box). F, The increased mean integrated slow PF-mediated Ca2+ signal in 82Q PNs: *F(1,10) = 8.13, p = 0.017, n = 6 each, two-way ANOVA; (S)MCPG reduced the Ca2+ signal in both WT and 82Q PN dendrites: F(1,10) = 6.3, p = 0.013, to similar values; p = 0.12, t test. F, Peak Ca2+ rises were similar across all PNs; p = 0.4, t test (n = 6); NS, nonsignificant. G, In the presence of (S)MCPG, the mean PF-evoked Ca2+ decay time constant, τ, is longer in 82Q PN dendrites; *p = 0.018, t test (n = 6). Error bars are mean ± SEM.
