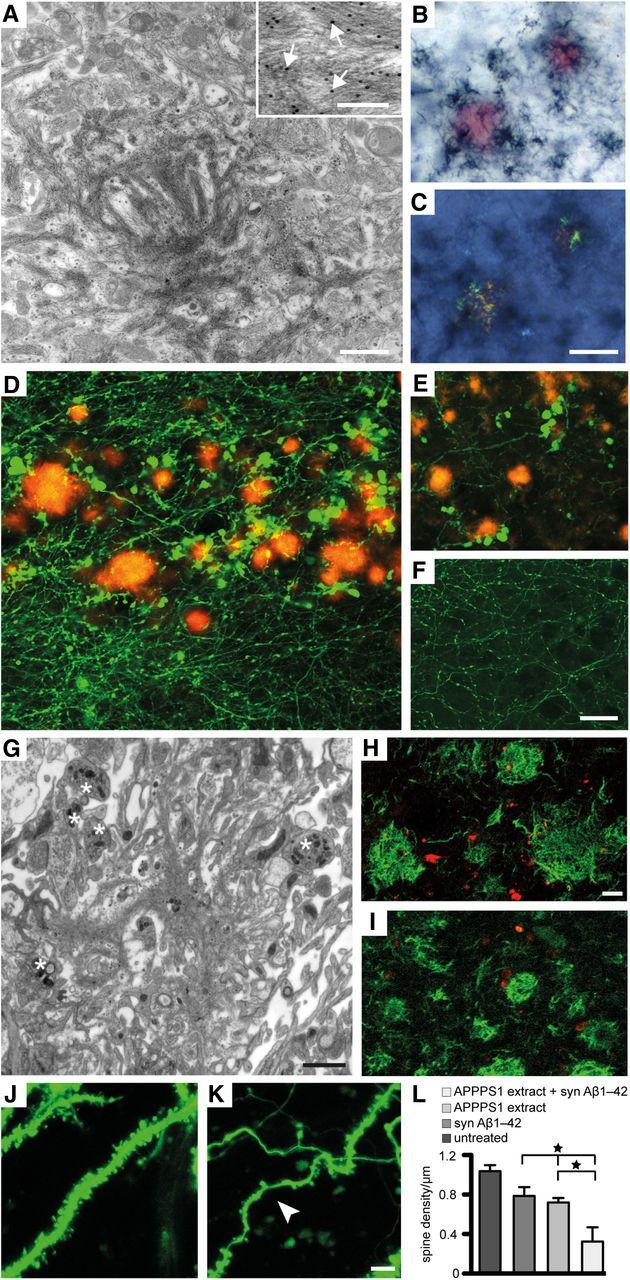
Figure 4.

Pathology associated with seeded Aβ deposition in 10-week-old HSCs. A, Immunoelectron microscopy of induced Aβ deposits in wild-type HSCs treated with APP23 tg brain extract once on top and continuously supplemented with synthetic Aβ1–40 in the media revealed the typical bundles of amyloid fibrils interdigitated with cellular elements. Inset, Anti-Aβ-immunogold labeled amyloid fibers (arrows) at high magnification. B, C, Congo red-stained compact Aβ deposits in HSCs treated as in A combined with Aβ immunostaining (dark-blue) under normal light (B) and with the characteristic apple-green birefringence between crossed polarizers (C). D, E, Dystrophic GFP-positive structures in the vicinity of the induced Aβ deposits (Aβ immunostaining, red) in HSCs of Thy1-GFP mice treated with APPPS1 brain extract and syn Aβ1–42. Dystrophic neuritic elements were observed in stratum oriens (D), but they were also found in stratum radiatum and stratum lacunosum-moleculare of CA1 (E). Dystrophic elements were virtually absent in untreated cultures (F), cultures treated only with brain extract or only with syn Aβ1–42 (data not shown). Immunoelectron microscopy reveals an amyloid plaque in the stratum oriens (G) surrounded by several dystrophic boutons (asterisk). H, I, Dystrophic structures and boutons were (at least partly) also immunopositive for hyperphosphorylated tau (AT8 antibody; H, red) and neurofilament light chain (I, red). The Aβ deposits were visualized with anti-Aβ immunostaining (green). J, K, Dendritic spines in HSCs prepared from Thy1-GFP mice. Dendritic segments with numerous spines were observed in untreated HSCs (J). In contrast, curved and thinned (arrowhead) dendritic segments with only very few spines were present in HSCs treated with APPPS1 extract and syn Aβ1–42 (K). The number of dendritic spines/μm on side branches of apical dendrites (CA1 pyramidal neurons, stratum radiatum) was significantly reduced in HSCs with Aβ deposits (L) compared with control cultures treated only with syn Aβ1–42 or APPPS1 brain extract and compared with untreated cultures (n = 4 cultures per group; 3–8 segments analyzed in each culture; ANOVA, F(3,12) = 10.21; p < 0.001). *p < 0.05 (post hoc Tukey's multiple comparison). Scale bars: A,1 μm; inset, 0.1 μm; B, C, 20 μm; D–F, 20 μm; G, 1 μm; H, I, 5 μm; J, K, 5 μm.
