Figure 5.
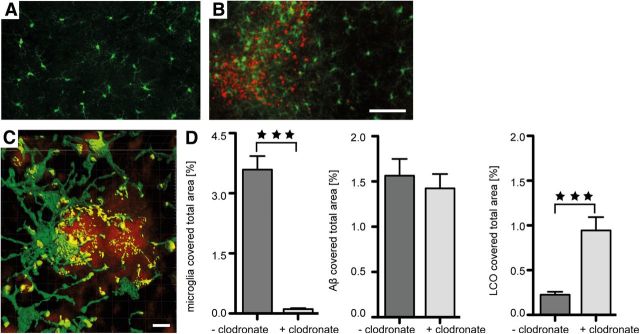
Microglia-amyloid interaction and microglia depletion in wild-type HSCs. A, B, Double immunolabeling of microglia (anti-Iba1, green) and Aβ (anti-Aβ, red) revealed the scattered distribution of microglial cells in untreated HSCs and thus in the absence of Aβ deposits (A). In contrast, in HSCs treated with APP23 brain extract and synthetic Aβ1–40, microglia were more numerous and appeared hypertrophic in areas rich in Aβ deposits (B). Scale bars: A, B, 20 μm. C, Confocal imaging and 3D surface reconstruction of microglia (Iba-1, green) and amyloid plaques (qFTAA, red) reveal a tight association of microglia processes with the amyloid suggestive of some uptake/interaction with the amyloid (yellow). Scale bar, 100 μm. D, Clodronate treatment of HSCs greatly depleted microglia. Shown are 8-week-old HSCs (n = 29 and n = 25 cultures/group for depleted and control, respectively. ***p < 0.001 (Mann–Whitney U test). A similar microglia depletion was already found after 1 week in culture consistent with previous reports (Kohl et al., 2003). Despite the microglia depletion, no significant effect on the induced total Aβ deposition was found (p = 0.640). However, when the amyloid-specific dye qFTAA was used, a significant increase was found (p < 0.001). Data are mean ± SEM.

