Figure 3.
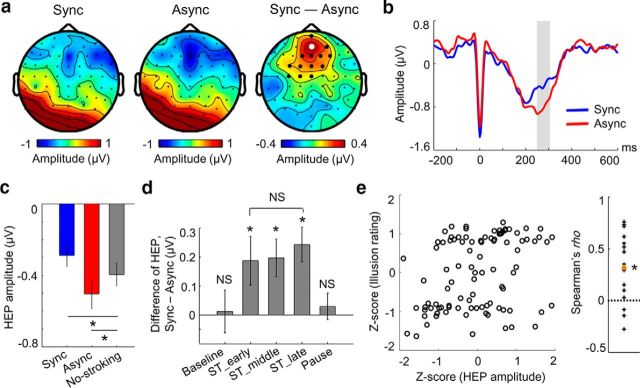
Neural responses to heartbeats reflect altered state of bodily self-consciousness. a, Topographical map of the HEP amplitude during the synchronous condition (left), asynchronous condition (middle), and their differences (Sync − Async; right) in the 250–305 ms time window in which a significant difference is observed. Larger black and white dots indicate the electrodes contributing to the significant cluster. b, Time course of HEPs at the electrode indicated by a white dot in a, which showed maximal difference. The shaded area highlights the time window in which a significant difference is observed (cluster-level p = 0.01, n = 16). c, Mean HEP amplitude averaged across the cluster during the synchronous and asynchronous conditions and during the no-stroking period (e.g., all the baseline and pause periods). d, Differences of the mean HEP amplitudes between synchronous and asynchronous conditions during the baseline, three equally sized time bins of stroking, and pause period. Differential HEP amplitudes were observed in each of the three stroking period time bins (all p < 0.05, n = 16), but not in the baseline or pause period (both p > 0.4, n = 16). e, Illusion rating as a function of the mean HEP amplitude across blocks in each subject (left). Each dot indicates a block. Spearman's ρ in each subject is shown on the right. Each cross indicates a subject and the orange dot indicates the grand-averaged Spearman's ρ across 16 subjects, which was significantly larger than 0 (permutation test, p = 0.004, n = 16). Error bars indicate SEM. *p < 0.05. NS, Not significant.

