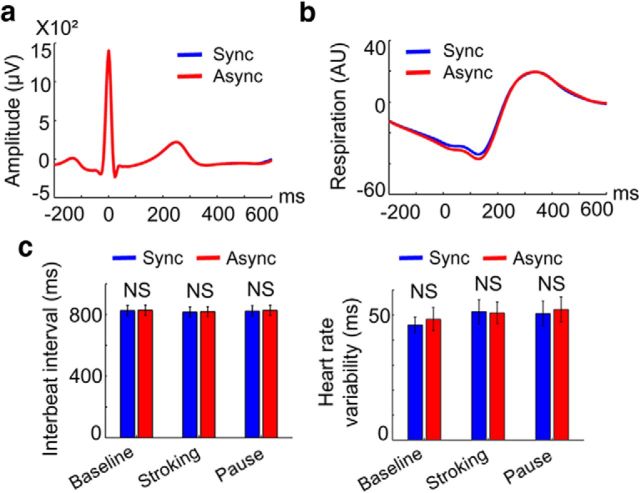
Figure 5.
ECG amplitude, interbeat interval, heart rate variability, and respiratory activity did not differ between conditions. a, R-peak-locked ECG signals during the stroking. No difference between synchronous and asynchronous conditions was observed (all p > 0.1). Note that the blue curve is fully covered by the red curve. b, R-peak-locked respiratory signals during the stroking period. No difference between synchronous and asynchronous conditions was observed (all p > 0.2). c, Interbeat interval (left) and heart rate variability (right) during the baseline, stroking, and pause periods. No difference between synchronous and asynchronous conditions was observed (all p > 0.3).

