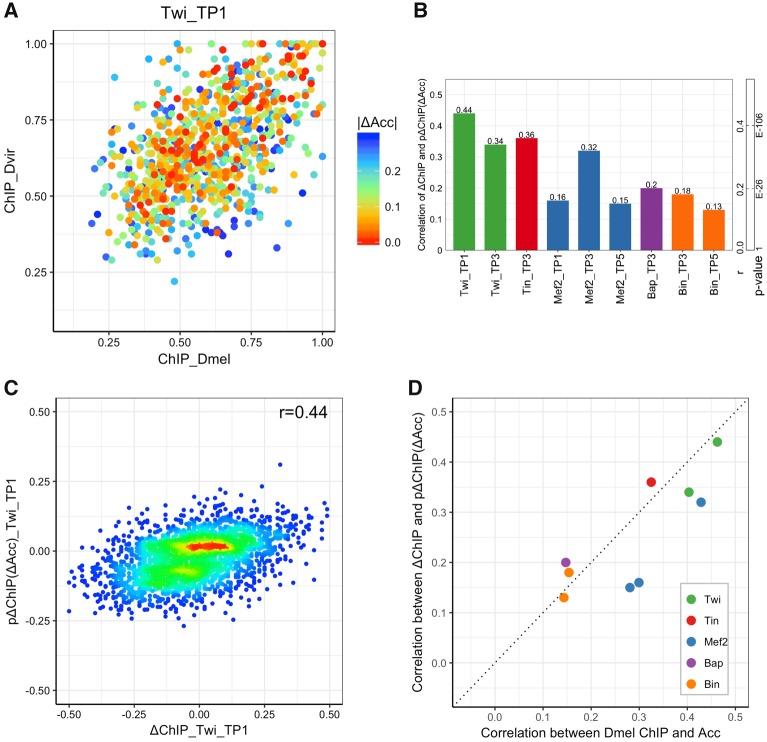
Fig. 2.
—Accessibility changes alone are modest predictors of TF occupancy changes between species. (A) Scatter plot of Drosophila melanogaster ChIP scores versus Drosophila virilis ChIP scores for Twi at TP1. Points represent orthologous enhancers that are accessible in at least one species. Colors indicate change of accessibility score. (B) Correlation coefficient between measured ΔChIP and ΔChIP predicted based on ΔAcc, denoted as “pΔChIP(ΔAcc).” P values of PCC (r) with sample size of 2,754 are also shown. (C) Scatter plot of ΔChIP versus pΔChIP for Twi at TP1. Warmer colors indicate greater point density. (D) Correlation between ChIP and accessibility in D. melanogaster (x axis) is compared with correlation between interspecies ΔChIP and pΔChIP(ΔAcc).

