Fig. 3.
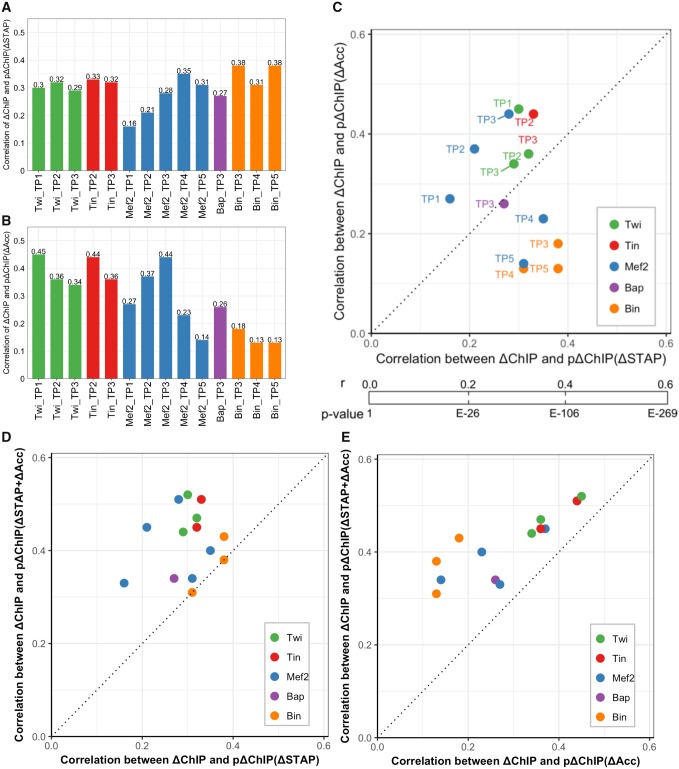
—Changes in motif presence and accessibility are both predictive of TF occupancy change. (A) Correlation between measured ΔChIP and ΔChIP predicted by models based on motif presence changes, denoted by “pΔChIP(ΔSTAP).” For each TF-TP condition, average PCC from 5-fold cross-validation is reported. (B) Similar to (A), except that the ΔChIP predictions are now based on changes in accessibility, denoted by “pΔChIP(ΔAcc).” These values are similar to those reported in figure 2B, but with slightly modified models (see text). (C) Comparison of motif-based models (x axis) and accessibility-based models (y axis). P values of PCC (r) with sample size of 2,754 are also shown. (D, E) Predictions of ΔChIP based on both motif changes and accessibility changes, denoted by “pΔChIP(ΔSTAP + ΔAcc),” are better than using only motif changes (D) or only accessibility changes (E).

