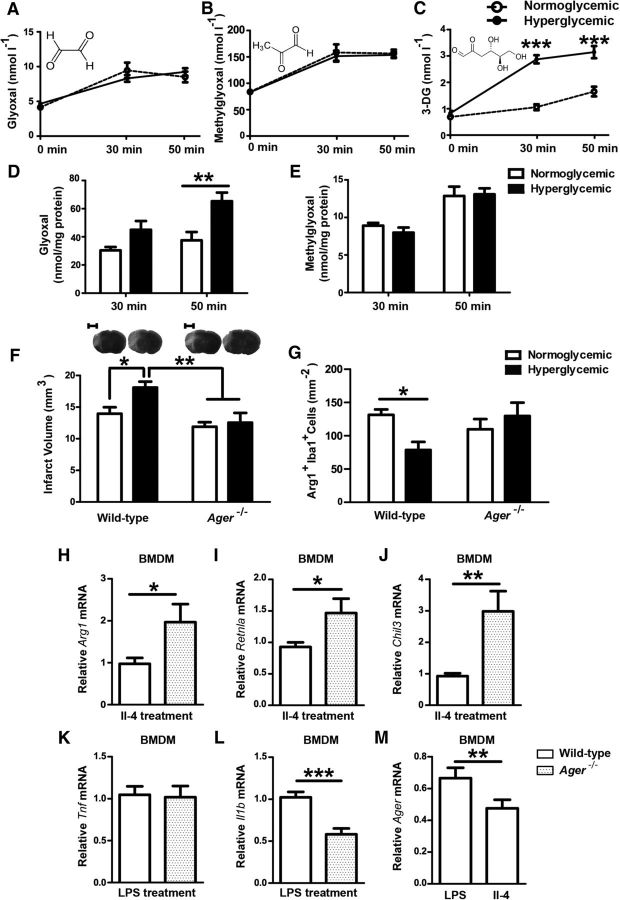
Figure 6.
AGER increases the infarct volume during hyperglycemic stroke and impairs macrophage polarization to a noninflammatory cell type. A, B, Concentrations of the α-dicarbonyls glyoxal, MG, and 3-DG were measured before glucose injection (0 min) and 30 min and 50 min after hyperglycemic stroke in plasma. Only 3-DG revealed a significant increase under hyperglycemic conditions (A–C; for glucose treatment, F(1, 56) = 107.07, p < 0.0001,***p < 0.001, Bonferroni posttests, n = 8 mice/group). In brain extracts, only glyoxal was elevated significantly by hyperglycemia (D, E; for glucose treatment, F(1, 27) = 14.47, p = 0.0007, **p < 0.01, Bonferroni posttests, n = 8 mice/group). F, Hyperglycemic Ager−/− mice had smaller infarcts than wild-type mice 48 h after MCAO. Typical silver-stained coronal brain sections showing infarcts in light gray are depicted on top of the panel. Two-way ANOVA, for glucose treatment F(1, 32) = 4.75, p = 0.0368. *p < 0.05, **p = < 0.01 (Bonferroni posttests, n = 9 mice/group). Scale bar, 2.5 mm. G, Hyperglycemia did not reduce noninflammatory Arg1+Iba1+ macrophages in the peri-infarct tissue of Ager−/− mice, in contrast to wild-type mice, 48 h after MCAO. The total number of Iba1+ cells did not differ between treatment groups. Two-way ANOVA, for interaction between glucose treatment and genotype F(1, 23) = 6.03, p = 0.022. *p < 0.05 (Bonferroni posttests, n = 8 mice/group). H–J, After polarization to a noninflammatory phenotype with IL-4, AGER-deficient macrophages had higher mRNA levels of the noninflammatory marker genes Arg1, Chil3, and Retlna than wild-type controls. K, L, Conversely, after polarization using LPS, AGER-deficient macrophages had lower mRNA levels of the inflammatory marker Il1b than wild-type controls, although Tnf levels did not differ. M, In vitro Ager mRNA expression was higher in inflammatory than in noninflammatory macrophages. *p < 0.05, **p < 0.01, ***p < 0.0003 (n = 12 with 4 wells in three independent experiments, unpaired t test). Data are shown as means ± SEM.

