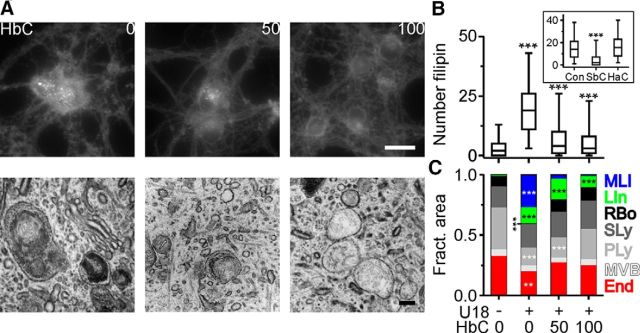
Figure 5.
HbC-induced reversal of cholesterol accumulation in lamellar inclusions. A, Fluorescence and electron micrographs showing filipin distribution (top) and ultrastructure (bottom) of RGCs treated with U18 and for the last 24 h with HbC at indicated concentrations (in micromolar). Scale bars: top, 20 μm; bottom, 200 nm. B, Number of filipin-positive puncta in somata of RGCs treated with U18 and with HbC [control (Con), n = 410 cells; U18, n = 548; U18 + 50 μm HbC, n = 470; U18 + 100 μm HbC, n = 450; 5 preparations] or with SbC (100 μm) and HaC (100 μm; inset, control treated with U18, n = 490 cells; SbC, n = 211 cells; HaC, n = 366 cells; 3 preparations). C, Average fractional area of endosomal–lysosomal compartments in RGCs treated as indicated (Con, n = 41 cells; U18, n = 52 cells; U18 + 50 μm HbC, n = 46 cells; U18 + 100 μm HbC, n = 45 cells; 3 preparations). **p < 0.01; ***p < 0.001.

