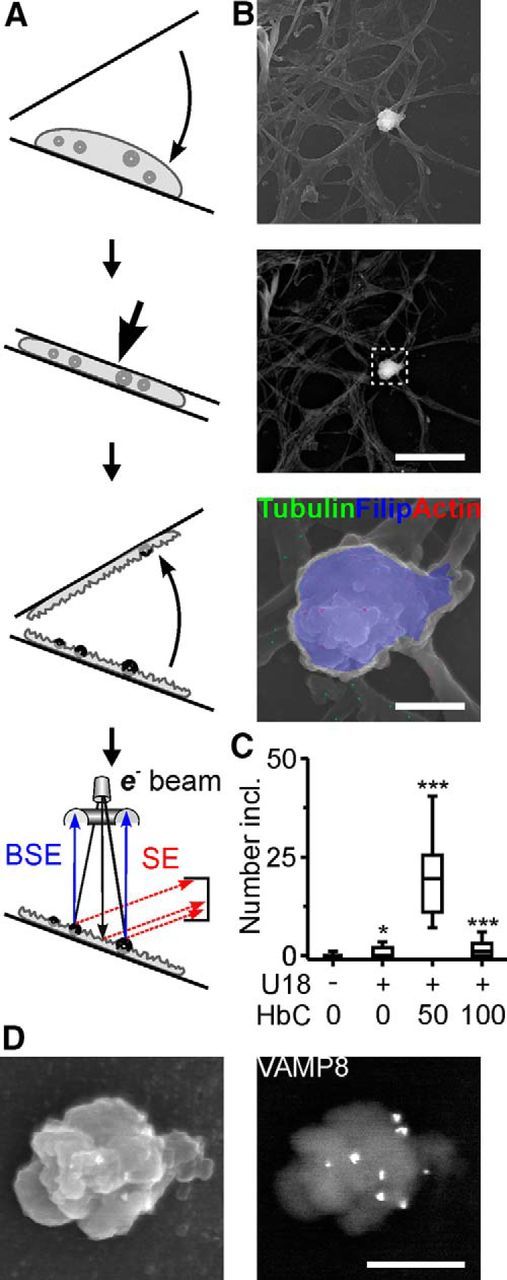
Figure 7.

HbC-induced accumulation of lamellar inclusions at the cytoplasmic face of the plasma membrane. A, Diagrams illustrating horizontal cell fracturing and scanning electron microscopy with secondary electron and BSE detection to visualize the cytoplasmic face of the neuronal plasma membrane. B, Scanning electron micrographs (top, secondary electron; middle, bottom, BSE) showing the cytoplasmic face of the plasma membrane after fracturing of an U18- and HbC-treated RGC. Bottom, High-magnification false-color image of outlined area showing an inclusion with overlay of secondary electron (gray scale) and BSE signals (color) after filipin staining (blue) and immunogold labeling to reveal tubulin (green) and actin (red). C, Number of cholesterol-rich inclusions at the cytoplasmic face of the plasma membrane under indicated conditions (n = 100 cells per condition; 4 preparations). D, Scanning electron micrographs of an U18- and HbC-treated (100 μm) RGC after cell fracturing (left, secondary electron; right, BSE). Note the cholesterol-rich inclusion at the cytoplasmic face of the plasma membrane covered with immunogold labeled clusters of VAMP8. Scale bars: B, top, middle, 10 μm; bottom, 1.5 μm; D, 1 μm. *p < 0.05; ***p < 0.001.
