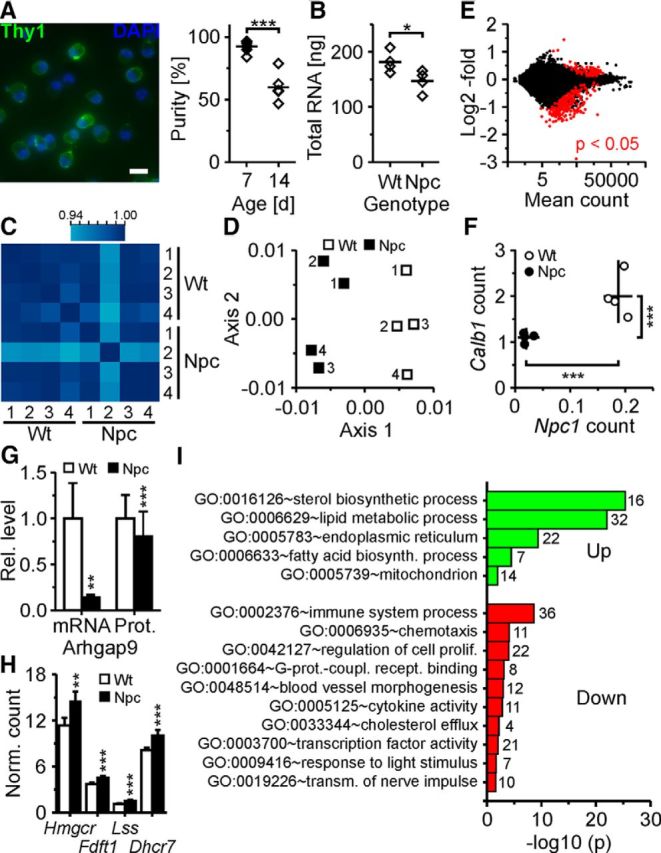
Figure 8.

Gene expression profiling by RNAseq of RGCs acutely purified from wild-type and NPC1-deficient mice. A, Left, false-color micrographs of RGCs acutely purified from 1-week-old mice by immunopanning and subjected to nuclear staining with DAPI (blue) and to immunocytochemical staining for Thy1 (green). Scale bar, 20 μm. Right, percentage of Thy1+ cells after isolation from retinae of 1-week-old (n = 9) and 2-week-old mice (n = 5; t test). Immunopanning delivered ∼73,000 ± 8,000 Thy1-positive cells per 1-week-old mouse (n = 5). B, Quantity of total RNA in purified RGCs per mouse (n = 4 mice per genotype corresponding to biological replicates; t test). C, Heat map of Pearson's correlation coefficient showing the reproducibility of transcript counts among biological replicates. D, First factorial plane resulting from a correspondence analysis of variance-stabilized data with the x-axis and y-axis explaining 23 and 22% of the variability of the whole dataset, respectively. E, Mean fold changes of transcript counts in RGCs from 1-week-old mutant mice compared to wild-type littermates plotted against normalized mean counts of each transcript as revealed by RNAseq. Red dots indicate genes with an adjusted p value of <0.05. F, Counts of indicated transcripts divided by gene lengths in RGCs from individual mice as indicated (lines indicate means). G, Means of relative transcript counts and relative fluorescence intensities of ARHGAP9 revealed by RNAseq (n = 4 per genotype; t test) and by immunocytochemical staining of acutely isolated RGCs, respectively (WT, n = 443 cells; NPC, n = 492 cells; 3 preparations; Mann–Whitney U test). H, Transcript counts divided by gene lengths of selected cholesterol-synthesizing enzymes in purified RGCs revealed by RNAseq (n = 4 per genotype; values divided by 1000). I, Enrichment of gene ontology terms (numbers of genes per GO term) in transcripts of RGCs from mutant mice compared to wild-type littermates (n = 4 mice per genotype). Unless indicated otherwise, p values are from t tests adjusted by the Benjamini–Hochberg method. *p < 0.05; **p < 0.01; ***p < 0.001.
