Figure 1.

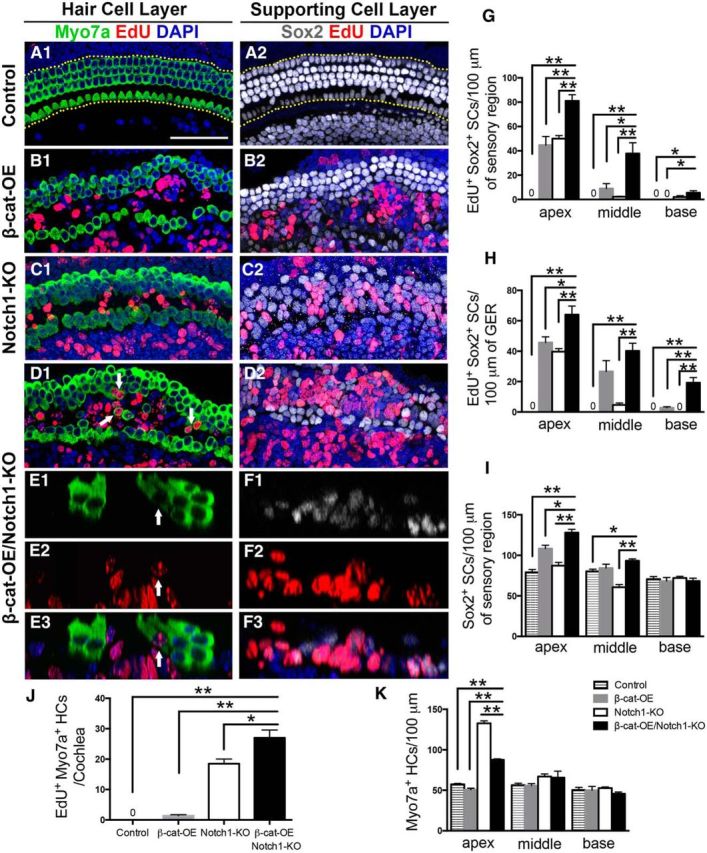
β-catenin overexpression (β-cat-OE) and Notch1 deletion (Notch1-KO) in Sox2+ cells induces extensive proliferation of SCs in the cochlea, but mitotic HC generation is limited. A, In control cochleae, no EdU+Sox2+ SC or EdU+Myo7a+ HCs were detected from P0 to P7. B, In β-cat-OE cochleae, numerous EdU+Sox2+ SCs were detected in the pillar cell region and GER of the SC layer (B2), but only a few EdU+Myo7a+ HCs were observed in the HC layer (B1). C, In Notch1-KO cochleae, most EdU+Sox2+ SCs were observed in the pillar cell region and GER in the SC layer (C2) and EdU+Myo7a+ HCs could only be observed in the sensory region of the HC layer (C1). D, In β-cat-OE/Notch1-KO cochleae, EdU+Sox2+ SCs were detected, not only in the pillar cell region and GER, but also in the Dieter's cells D2, Only limited numbers of EdU+ Myo7a+ HCs in the sensory region were detected. E, F, The tissue cross-section also shows the proliferation of SCs and the limited mitotic HC generation. Most of the EdU+Sox2+ cells were observed in the pillar cell region and Dieter's cell region and SCs in this region were stacked in multiple layers. G, H, The number of EdU+Sox2+ SCs was increased in β-cat-OE/Notch1-KO cochleae relative to the β-cat-OE and the Notch1-KO cochleae both in the sensory region and the GER. I, The number of Sox2+ SCs in the sensory region. J, Quantification and comparison of the number of EdU+Myo7a+ HCs from the apex to the base. The β-cat-OE/Notch1-KO cochleae had significantly more mitotic HCs. K, The number of Myo7a+ HCs. Data in G–K are presented as mean ± SEM. *p < 0.05, **p < 0.01. The dotted lines in A1 show the counting limits of SCs in the sensory region and GER. The arrows indicate the mitotic HCs. Scale bar, 50 μm.
