
Figure 3.
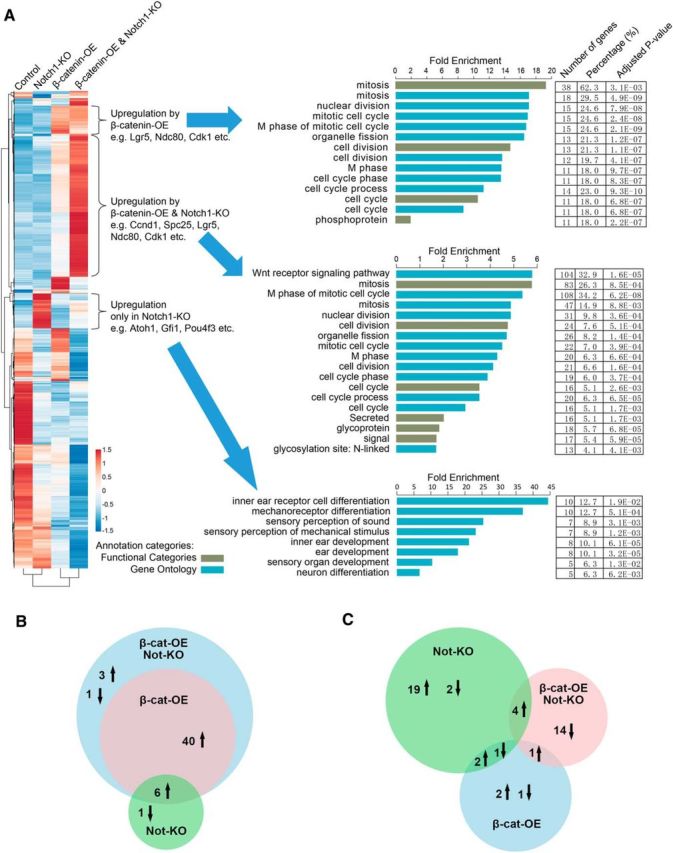
Global comparisons of gene expression among four different transgenic mouse lines and the expression pattern of genes by hierarchical clustering. A, Hierarchical clustering of the expression patterns of all differentially expressed genes. Red represents above-average expression levels and blue represents below-average levels. Each row represents one gene and each column represents one sample. Three gene clusters of interest were selected. B, Analysis of differentially expressed genes involved in the cell cycle and mitosis. C, Analysis of differentially expressed genes related to HC differentiation and function.