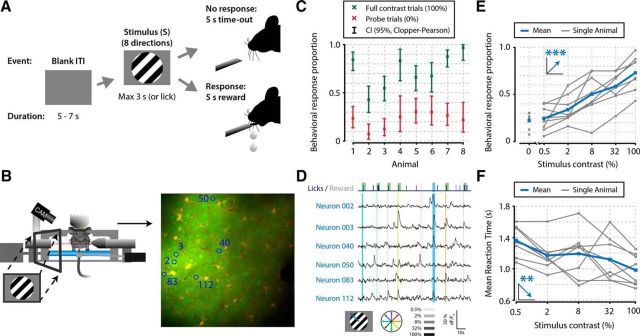
Figure 1.
Mice perform a go/no-go stimulus detection task during in vivo calcium imaging of V1 populations. A, Task schematic showing a single trial. In each trial, one of a combination of eight different directions and six contrasts was presented. Two of these contrasts were probe trials: a 0% contrast isoluminant gray blank screen was used to infer the FA rate, and a 100% full contrast stimulus was used to infer the lapse rate. The order of presentation of stimulus contrast and direction was randomized per block of 48 trials (6 × 8). At the first licking response during visual presentation, the stimulus was turned off and mice received a reward (sugar water). B, Schematic of the behavioral setup with example recording field of view. The mouse's pupil was monitored, and licking responses and running on a treadmill were recorded. C, The eight animals included in this study showed statistically significant stimulus detection during calcium imaging, quantified by nonoverlapping 2.5–97.5th CP percentile CIs (95% CI) (p < 0.05) of behavioral response proportions for 0% (red) and 100% (green) contrast probe trials. D, Example of simultaneously recorded licking responses and traces of neurons labeled in B. Blue or green ticks and gray shaded areas in the top row represent licking and reward presentation, respectively. Vertical colored bars represent stimulus presentations; width, color, and saturation represent duration, orientation, and contrast respectively. E, F, Mice showed higher behavioral response proportions (linear regression analysis, ***p = 1.07 × 10⁻⁷; E) and faster reaction times (**p = 0.004; F) with higher stimulus contrasts. Figure elements adapted from Montijn et al. (2015).

