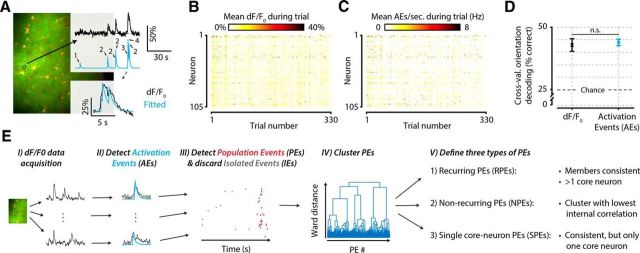
Figure 2.
Schematic explaining and validating the procedure of detecting AEs and PEs in calcium imaging data. A, For each neuron, we detected putative spiking events with a previously published procedure (Greenberg et al., 2008), which is based on finding a summation of exponential decay functions that minimizes the error with the fluorescent dF/F0 calcium signal. B, C, Example dataset of one animal before (B) and after (C) AE detection. Mean neural responses per trial (x-axis) and neuron (y-axis) in dF/F0 are similar to those in number of AEs (element-wise Pearson correlation, mean ± SEM across animals: r = 0.78 ± 0.016). D, A cross-validated orientation decoder performs equally well on raw dF/F0 signals as on AE-detected signals, which represent a drastically data-reduced version of the original signal (paired t test across animals, n = 8, p = 0.739, not significant). Equal decoding performance, despite severe data reduction, shows that the amount of stimulus information in the neural signal is not affected by the AE detection procedure. E, Flowchart summarizing the data analysis steps as follows: EI, Calcium-imaging data are acquired and preprocessed. EII, AEs are detected in each neuron's dF/F0 trace. EIII, AEs that are temporally concurrent are grouped into PEs. EIV, All PEs are clustered based on which neurons are participating. EV, Clustering yields three types of PEs: those that show a recurring configuration of neurons (RPEs), those that do not (NPEs), and those that show a recurring configuration but have only one core neuron (SPEs). n.s., Not significant.

