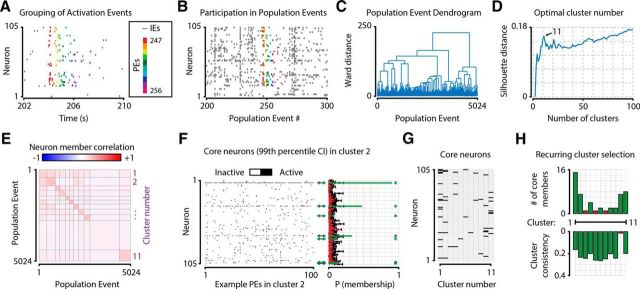
Figure 3.
Grouping of AEs into PEs and subsequent Ward-method cluster analysis allow the determination of recurring neuronal clusters. A–H, The procedure in one example animal. A, AEs were grouped into PEs (dots of same color), which were initially defined as epochs where periods of nonactivity were never >39.4 ms (the duration of one acquisition frame). PEs were subsequently discarded if they were <78.8 ms (two acquisition frames) or when fewer than three neurons participated. Discarded events (i.e., IEs, gray dots) were not used for further analysis. B, To determine the similarity in neuronal configuration between PEs, each PE was transformed into a Boolean vector, where each element represents a single neuron, and “True” indicated whether the neuron participated in that event. Colored PEs refer to the same events as those shown in A. Gray PEs represent additional example events. C, A Ward-method clustering procedure on PE membership vectors yielded a hierarchical dendrogram, where short distances between events indicate a high similarity in the configuration of participating neurons. D, A silhouette distance analysis for different numbers of clusters provided an estimate of the optimal number of different configurations of neurons, which in this example animal was 11. E, The correlation matrix of similarity in neuronal members between all PEs, grouped by cluster, shows a higher within-cluster correlation than between-cluster correlation. In this animal, cluster 10 is the “rest group” of NPEs (i.e., the cluster with lowest within-group correlation). F, For each cluster (panel shows cluster 2 as example), we calculated which neurons were “core neurons” using a shuffling procedure that randomizes an AE's neuronal identity and estimates the chance level participation of all neurons in the cluster. Black error bars indicate mean ± 3 SDs. Significant core neurons (i.e., neurons with a participation above the 99th chance percentile) are shown in green (also marked by *) and nonsignificant neurons in red (right). G, Matrix showing core neurons for all 11 clusters. Black represents the neuron is a core neuron. White represents it is not. Neurons could be core members of multiple clusters. H, Clusters were defined as “recurring” when the cluster had at least two core neurons and did not have the lowest within-group correlation of all clusters in a single session. Green bar represents the cluster fulfills these requirements. Red bar represents it does not.

