Figure 7.
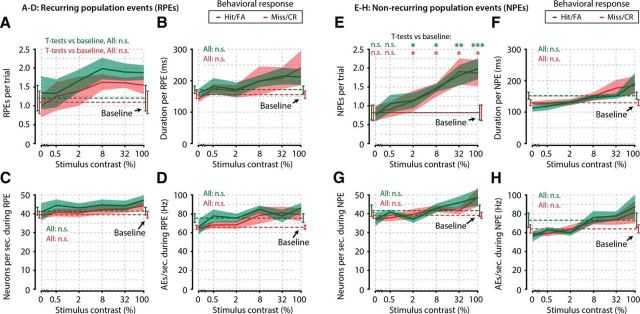
Several parameters of recurring and NPEs show no correlation with stimulus detection, and all PEs are stereotyped. A–D, Number of RPEs per trial (A), duration per RPE (B), number of neurons participating per second during RPEs (C), and number of AEs per second during RPEs (D), as a function of stimulus contrast, were identical when the animals made a response (green, Hit/FA) compared with when they made no response (red, Miss/CR) (FDR-corrected paired t tests, n = 8 animals, 6 tests per property, p > 0.05 for all comparisons, not significant). Moreover, these properties were not different during spontaneous PEs (Baseline, i.e., occurrences during 2 s preceding stimulus onset) compared with stimulus-evoked PEs (FDR-corrected paired t tests, n = 8 animals, p > 0.05 for all comparisons, not significant). E–H, Same as in A–D, but for NPEs. As for recurring events, there was no correlation of NPE properties with stimulus detection (FDR-corrected paired t tests, n = 8 animals, 6 tests per property, p > 0.05 for all comparisons, not significant). Interestingly, the number of NPEs did show a dependence on stimulus contrast (FDR-corrected paired t tests, stimulus-driven occurrences vs baseline, hits/FAs: 0%, p = 0.744; 0.5%, p = 0.184; 2%, p = 0.038; 8%, p = 0.014; 32%, p = 0.0011; 100%, p = 0.0007; misses/correct rejections: 0%, p = 0.895; 0.5%, p = 0.352; 2%, p = 0.045; 8%, p = 0.045; 32%, p = 0.036; 100%, p = 0.045), but several properties of NPEs did not (f-h, FDR-corrected paired t tests, n = 8 animals, p > 0.05 for all comparisons, not significant). These results show that some basic properties of PEs are statistically stereotyped and are not related to stimulus detection. *, p < 0.05; **, p < 0.005; ***, p < 0.001 n.s., Not significant.

