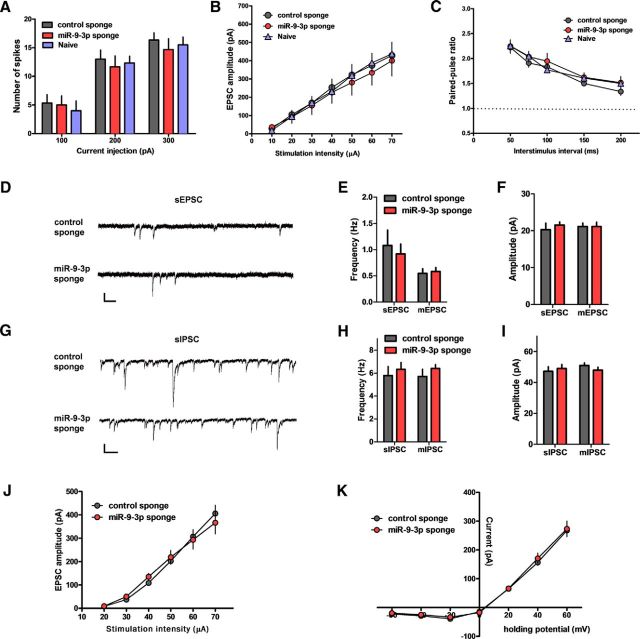
Figure 3.
AAV-miR sponge-mediated inhibition of miR-9-3p activity has no effects on basal synaptic properties and NMDAR-mediated synaptic transmission. A, Number of action potentials generated by current injection (n = 6 for each group). B, Input–output relationship (n = 7, naive; n = 8, control sponge; n = 6, miR-9-3p sponge). C, Paired-pulse ratio at the indicated interstimulus intervals (n = 6 for each group). D–F, sEPSCs and mEPSCs from CA1 pyramidal neurons expressing control sponge or miR-9-3p sponge. D, Representative sEPSC recording traces. Scale bars, 25 pA and 200 ms. Graphs show sEPSC (n = 6, control sponge; n = 11, miR-9-3p sponge) and mEPSC (n = 7, control sponge; n = 9, miR-9-3p sponge) frequency (E) and amplitude (F). G–I, sIPSCs and mIPSCs from CA1 pyramidal neurons expressing control sponge or miR-9-3p sponge. G, Representative sIPSC recording traces. Scale bars, 50 pA and 200 ms. Graphs show sIPSC (n = 10, control sponge; n = 9, miR-9-3p sponge) and mIPSC (n = 11, control sponge; n = 6, miR-9-3p sponge) frequency (H) and amplitude (I). J, Input–output relationship of NMDAR-mediated EPSCs (n = 8, control sponge; n = 11, miR-9-3p sponge). K, NMDAR-mediated I–V plot (n = 11, control sponge; n = 12, miR-9-3p sponge). Data are mean ± SEM.

