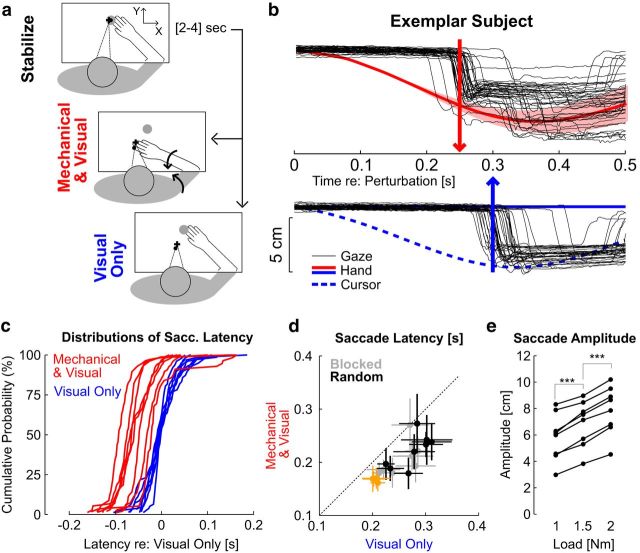
Figure 3.
Results of Experiment 1. a, Experimental paradigm. Participants were instructed to stabilize in the start target (top), then to visually track the cursor (small black dot) following Mechanical and Visual perturbation (red) or Visual Only (blue). The big gray dot illustrates the target used during the postural control task. The curved arrows (middle) illustrate the multi-joint perturbation torque applied on the limb. b, Individual eye movements from one representative subject (thin black), and average hand movement (solid) or cursor movement (dashed). The shaded area represents 1 SD across trials (hand and cursor traces are superimposed for the Mechanical and Visual perturbations). The vertical arrows illustrate the average saccade latency following combined mechanical and visual perturbations (red, top), or visual only (blue, bottom). c, Individuals' cumulative distributions of saccade latencies aligned on the 50th percentile of the distribution of responses to visual perturbations for each subject. d, Saccade latencies following each perturbation type. Crosses represent the mean ± SD across trials for each individual subject. Black and gray crosses correspond to random and blocked conditions, respectively. The orange crosses represent data from participants tracking a physical LED without any virtual reality display (see Materials and Methods, Control experiments). e, Modulation of saccade amplitude across perturbation magnitudes. Connected dots are the average saccade amplitude as a function of the perturbation load for each participant. Stars indicate significant differences based on paired comparisons with post hoc Bonferroni corrections (see Materials and Methods).

