Figure 9.
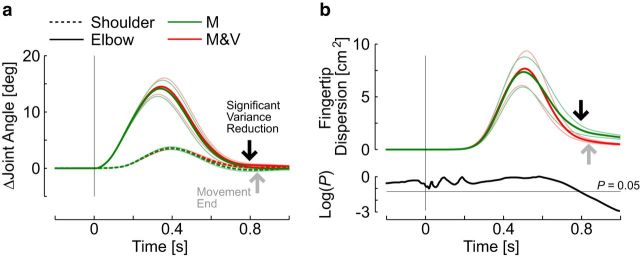
Upper-limb motor corrections. a, Ensemble average of perturbation-related changes in shoulder (dashed) and elbow (solid) joints following positive (flexion) perturbations. Perturbation trials with or without visual feedback are represented in red or green, respectively (data from Experiment 3). Thin lines represent 1 SEM. The vertical arrows illustrate the estimated time when vision contributes to reducing the endpoint variability (black arrow), as well as the movement end estimated from hand velocity (gray arrow; see Materials and Methods). b, Top, Two-dimensional fingertip dispersion area following perturbations (mean ± SEM). The SD area was computed from the covariance matrix of x- and y-coordinates at each time step. The area of fingertip dispersion across trials was computed for each perturbation direction independently, and averaged across directions (see Materials and Methods). Bottom, Time series of p values from paired t test comparison of fingertip standard dispersion across conditions with or without visual feedback. The black arrows corresponds to the time when the p value becomes <0.05.

