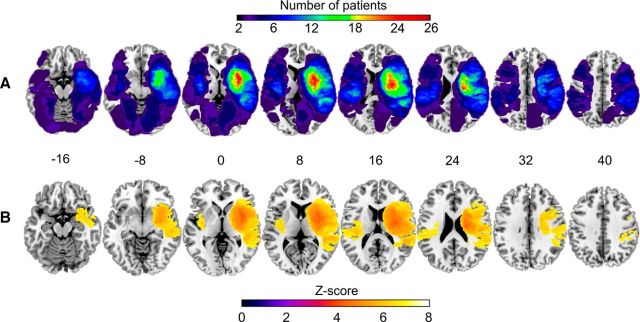
Figure 1.
Lesion-overlap maps for all subjects. A, Lesion distribution for the whole sample. Warmer areas indicate areas of greater lesion overlap. Accordingly, the color scale ranges from 2 to 26 overlapping subjects. B, Statistical power map for VLSM analyses with 77 patients. The map is thresholded at Z > 4 to view lesion areas with sufficient statistical power to detect an effect of Z ≥ 4.

