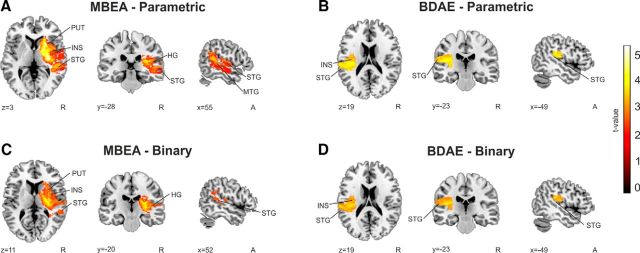
Figure 2.
VLSM results for amusia and aphasia. A, MBEA Scale and Rhythm average score (%). B, BDAE-ASRS score. C, Amusic versus NA patients. D, Aphasic versus nonaphasic patients. Amusia is based on MBEA Scale and Rhythm average score (cutoff, 75%) and aphasia is based on BDAE-ASRS (cutoff, <5). N = 77. Neurological convention is used with MNI coordinates at the bottom left of each slice. All statistical maps are thresholded at a FDR-corrected p < 0.05 threshold. INS, Insula; PUT, putamen.

