Figure 8.

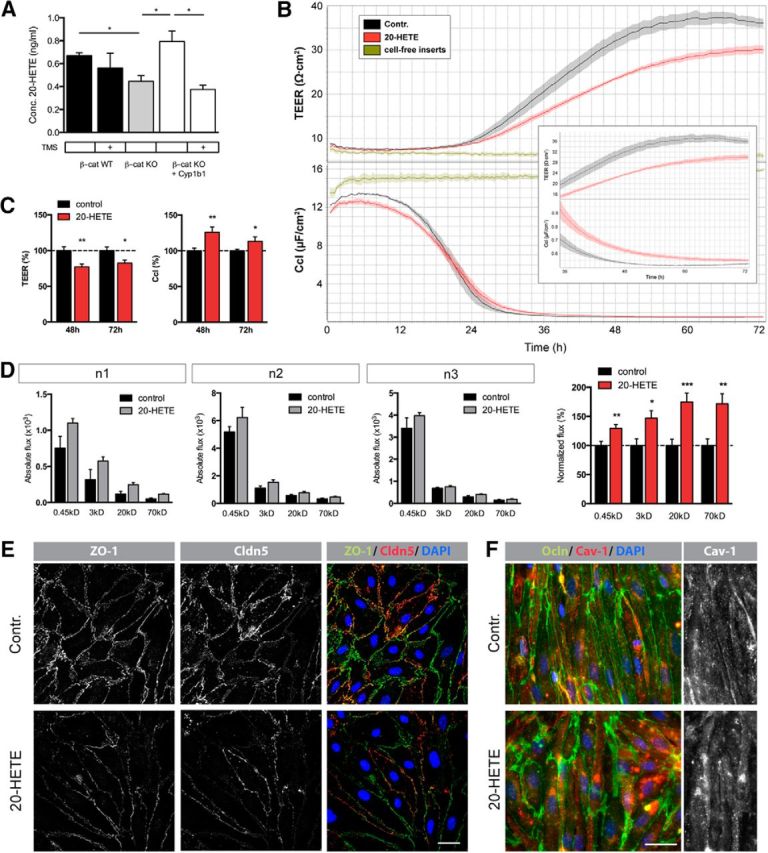
Cyp1b1 enzymatic activity modulates endothelial barrier function by influencing lipid metabolism. A, Levels of 20-HETE in the supernatant of β-catenin WT, LacZ- and Cyp1b1-infected β-catenin KO ECs after treatment with 10 μm arachidonic acid for 24 h with or without 5 μm TMS for 27 h (n = 3). B, Representative TEER and Ccl data of pMBMECs treated with 10 nm 20-HETE. Confluent cells were monitored for 72 h. Inlay represents a magnification of the course of TEER and Ccl values from 36 to 72 h. Cell-free inserts were used as internal control. C, Statistical analysis of TEER (top) and Ccl (bottom) values at 48 and 72 h calculated as percentage of control (dashed line, n = 3). D, Tracer assay performed after 72 h of stimulation with the same cells as used for B, C. Flux of 0.45 kDa Lucifer yellow, TXR 3 kDa-dextran, TMR 20 kDa-dextran, and FITC 70 kDa-dextran 1 h after tracer administration are shown as absolute values for each individual experiment and in percentage relative to control condition (dashed line) representing means of all three experiments. *p < 0.05. **p < 0.01. ***p < 0.001. Error bars indicate SEM. E, Representative pictures of immunofluorescence stainings for ZO-1 and Cldn5. Scale bar, 50 μm. F, Representative pictures of immunofluorescence stainings for Ocln and caveolin (Cav-1). Scale bar, 20 μm. Stainings were performed on the same cells used for B, C, D.
