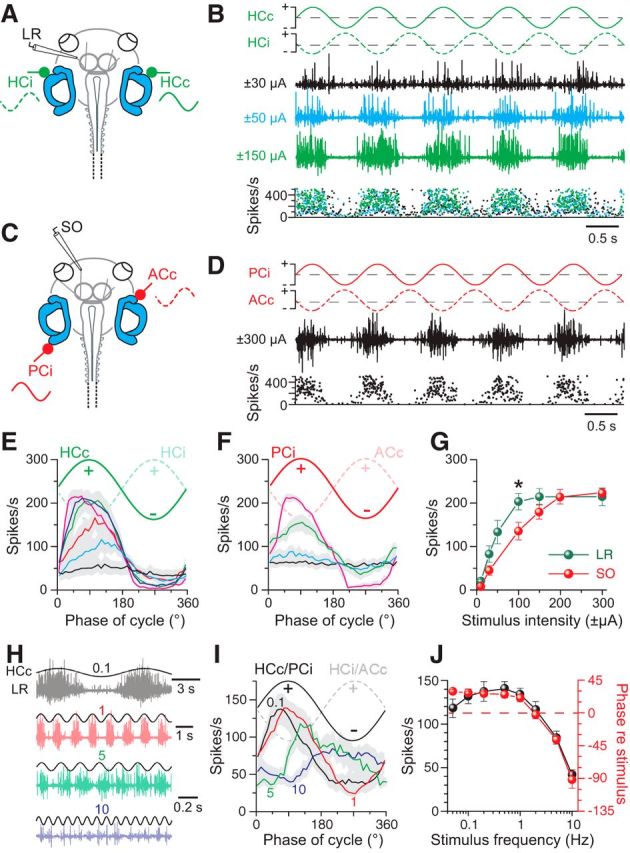
Figure 4.

Frequency and intensity dependence of GVS-induced multiple-unit discharge modulation in extraocular motor nerves. A, C, Extracellular recordings of the left LR (A) and SO (C) nerves during GVS of the bilateral HC cupulae (green HCc and HCi) and the left PC (PCi) and right AC (ACc) cupulae, respectively. B, Left LR nerve discharge during 1 Hz sinusoidal GVS of the bilateral HC cupulae (traces in top row) at three current intensities (black, blue, green traces) with peak firing rates (instantaneous rate, bottom plot) that increased with GVS amplitude. D, Left SO nerve discharge (black trace) and instantaneous firing rate (bottom plot) during sinusoidal GVS of the left PC and right AC cupulae (traces in top row). E, F, Averaged LR (E, n = 8) and SO nerve responses (F, n = 8) over a single GVS cycle at 1 Hz (from 16 cycles, ±SEM, gray shaded areas) increased with stimulus amplitude (color-coded responses were evoked by increasing currents: ±10, ±30, ±50, ±100, ±150, ±300 μA in E; ±10, ±30, ±100, ±200 μA in F). G, Dependency of averaged LR and SO nerve peak firing rates on GVS intensity; significance of difference between responses of the two nerves is indicated. *p < 0.05 (Mann–Whitney U test). H–J, LR nerve discharge during sinusoidal GVS (±100 μA) of the bilateral HCs at four different stimulus frequencies (color-coded traces; H); averaged LR/SO nerve responses (from 16 cycles, ±SEM, gray shaded areas) over a single GVS cycle at 0.1, 1, 5, and 10 Hz (color-coded curves) and a stimulus intensity of ±100 μA (n = 8; I) reveal amplitude (black symbols) and phase dependency (red symbols) of the responses on stimulus frequency (J). The stimulus in H indicates polarization of the HCc; numbers in H and I indicate frequency in Hz.
