
Figure 5.
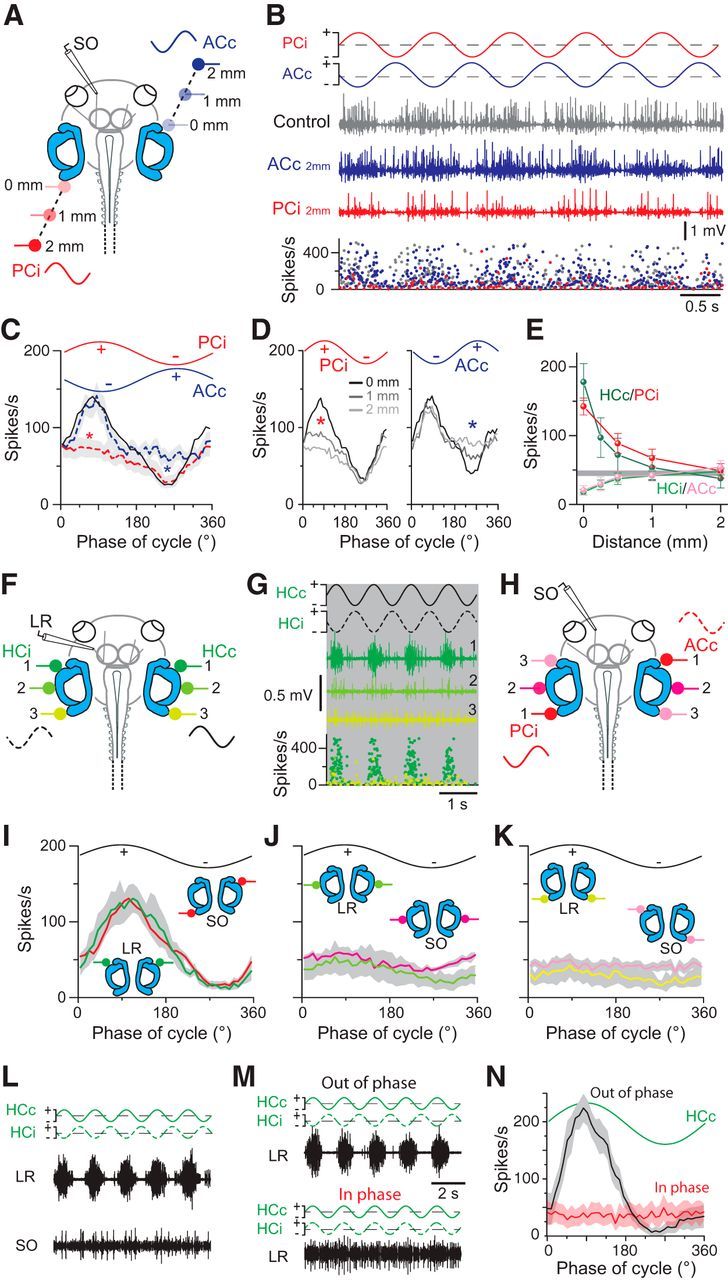
Stimulus site dependency of GVS-induced multiunit discharge modulation in extraocular motor nerves. A, Extracellular recordings of the SO nerve during GVS of the left PC (PCi) and right AC (ACc) cupulae at different distances from the sensory epithelia (color-coded stimulus electrodes). B, Left SO nerve discharge (middle traces) and instantaneous firing rate (bottom plot) during sinusoidal GVS of the left PC and right AC cupulae (traces in top row), with both electrodes close to the respective cupula (gray trace) and after independent repositioning of the ACc (blue trace) or PCi electrode (red trace) to a distance of 2 mm from the respective cupulae. C, Averaged responses over a single GVS cycle (from 16 cycles; ±SEM, gray shaded areas; n = 6) with both stimulus electrodes close to the cupulae (black trace) and with the ACc (blue dashed trace) or PCi electrode (red dashed trace) at a distance of 2 mm from the cupula; Note the absence of either the inhibitory (blue asterisk) or the excitatory component (red asterisk) under the latter two stimulus conditions. D, Averaged responses over a single GVS cycle (from 16 cycles in n = 6 preparations) with the PCi or ACc electrode at increasing distances from the epithelium; note the gradual reduction of excitatory (red asterisk) and inhibitory components (blue asterisk), respectively. E, Dependency of HCc/PCi-evoked excitatory and HCi/ACc-evoked inhibitory response components in the LR and SO nerves on electrode position; the horizontal gray bar indicates the mean ± SEM of the LR/SO resting rates. F, H, Recordings of the LR (F) and SO nerve (H) during GVS of the HCc/HCi and the PCi/ACc cupulae and after bilateral electrode repositioning (n = 10; color-coded electrodes 1–3 in F, H). G, Left LR nerve discharge (color-coded traces) and instantaneous rate (bottom plot) during sinusoidal GVS of the HCc/HCi cupulae (traces in top row) at three stimulus electrode positions (1–3, defined in F). I–K, Averaged responses of the LR and SO nerves over a single GVS cycle (from 16 cycles, ±SEM, gray shaded areas; n = 10) evoked with both electrodes close to the cupulae (HCc/HCi, PCi/ACc in I) and after bilateral repositioning of the electrodes (J, K; color-coded electrodes also in F, H). L, Simultaneous recordings of the left LR (top trace) and SO (bottom trace) nerve during 0.5 Hz sinusoidal GVS (±50 μA) of the bilateral HC cupulae. M, N, LR nerve discharge during sinusoidal GVS (0.5 Hz; ±100 μA) of the bilateral HC cupulae with sinusoids that polarized the two stimulus electrodes either in phase opposition (out of phase; top traces in M) or in phase alignment (in phase; bottom traces in M); averaged extraocular motor responses (N, n = 7) over a single GVS cycle at 0.5 Hz (from 16 cycles, ±SEM, gray and light red shaded areas) with out-of-phase (black curve) or in-phase (red curve) polarization. Scale bar in M applies also to L.