
Figure 3.
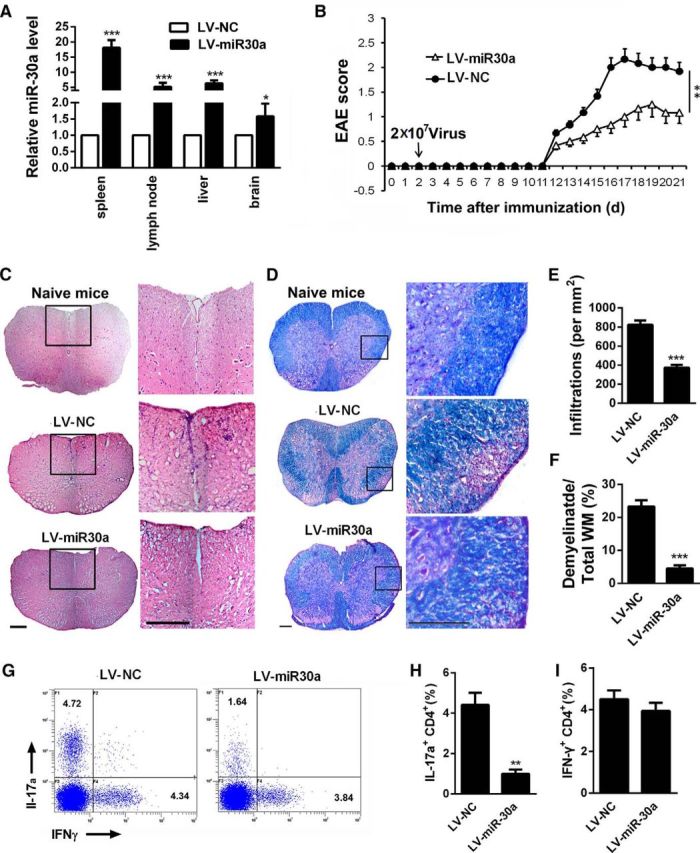
Preventing the full development of EAE by miR-30a. A, qPCR analysis of miR-30a in the liver, spleen, PLNs, and brain of mice injected with lentivirus encoding miR-30a (LV-miR-30a) or its control (LV-ctrl) at day 7 after lentivirus administration (n = 4 mice per group). B, Clinical scores of EAE in mice infected with lentivirus in A (n = 10 mice per group). EAE scores were analyzed using nonparametric Mann–Whitney U test. C, D, Representative spinal cord sections of H&E staining (C) and LFB staining (D) from EAE mice at day 21 after immunization. Scale bars, 70 μm. E, F, Quantification of spinal cord infiltration in white matter (WM) (E) and the percentage of demyelinated WM in total WM (F) in C and D (n = 3 mice per group). G, Intracellular staining of IL-17a and IFN-γ in DLN cells isolated from lentivirus-infected mice on day 14 after immunization. Numbers in quadrants indicated frequency of CD4+ cells. H, I, Frequency of CD4+IL-17a+ (Th17) cells (H) and CD4+IFN-γ+ (Th1) cells (I) in G (n = 3 mice per group; *p < 0.05, p < 0.01, ***p < 0.001 vs control; A, E, F, H, I, Student's t test; B, Mann–Whitney U test). Data are shown as mean ± SEM.