
Figure 7.
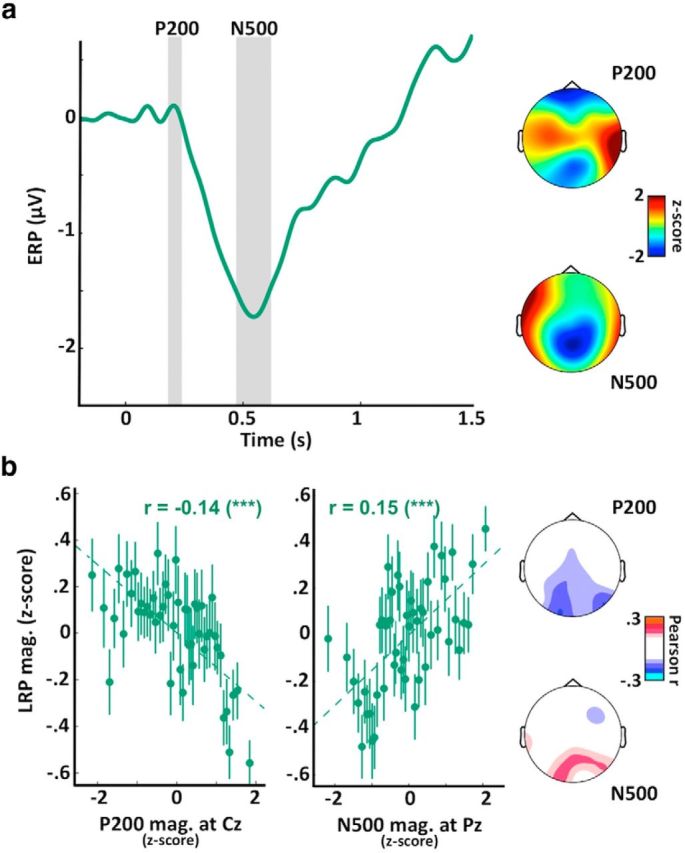
Evoked responses to sounds correlate with LRP magnitude in REM sleep. a, ERPs computed at Cz for trials in REM sleep. Two distinct potentials are again visible: a positivity ∼200 ms (P200) maximal at central electrodes (see scalp topography on the top right); and a negativity ∼500 ms (N500) maximal at parietal electrodes (see scalp topography on the bottom right). Scalp topographies were established by averaging the voltage over windows around the two potentials of interest (see gray areas on ERP plot). These values were averaged across participants and z-scored across channels to emphasize regional differences. These two potentials are quite different from the potentials described in NREM (Fig. 6a) in terms of temporal profile, amplitude, and topography. b, Correlations between the LRP magnitude and the P200 magnitude (left) or the N500 magnitude (right, opposite of amplitude) for trials in REM sleep. The P200 and N500 magnitudes were computed at Cz and Pz, respectively. Correlation between the pairs of variables was assessed using Pearson's method, with coefficients displayed on each subplot along with their significance levels. ***p < 0.005. Dotted lines indicate the linear fit between the two pairs of variables. Values were z-scored across trials for each participant before being aggregated across participants. Values were binned for visual purpose (N = 50 bins on the sorted x-axis variable). Error bars indicate the SEM of the LRP magnitude for the corresponding bin. Scalp topographies on the right represent the Pearson coefficients computed for each sensor (nonsignificant coefficients were set to 0, p > 0.05, FDR corrected for multiple comparisons). Similar correlations were obtained when focusing on practiced words (data not shown).