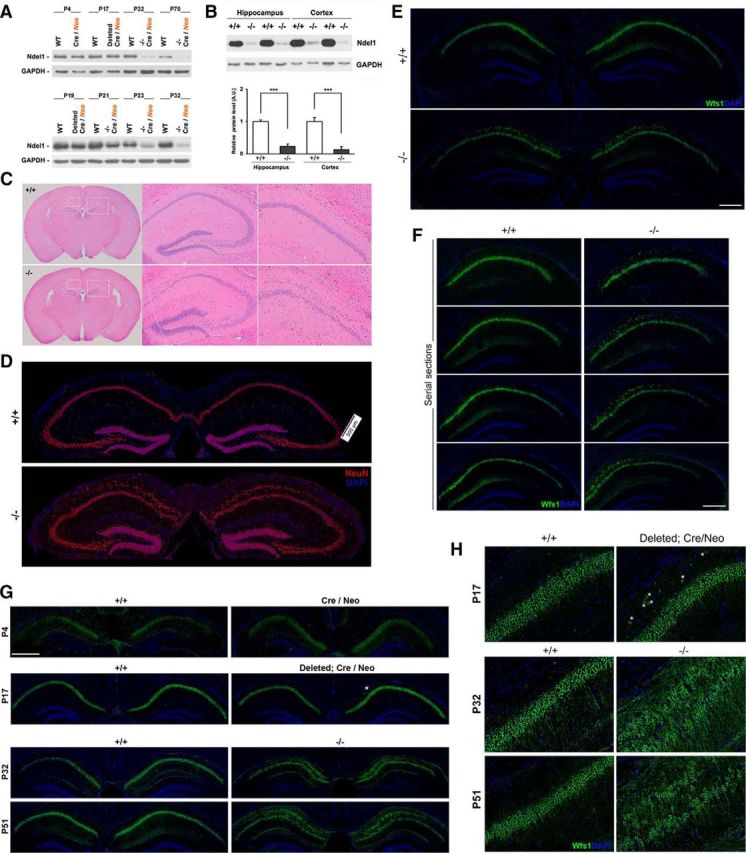
Figure 1.

Hippocampal Ndel1 expression levels and postnatal dispersion of CA1 pyramidal neurons in Ndel1 CKO mice. A, Levels of Ndel1 protein in forebrain excitatory neurons of Ndel1 CKO mice start to decrease around P19 and the decline is accentuated at P21 and P23. Minimal levels of Ndel1 that persist throughout lifespan are detected at P32. Residual levels of Ndel1 are expressed by glial cells and other neuronal cell types not targeted by the KO strategy. Because of the turnover of the Ndel1 polypeptide, the protein levels are not totally downregulated until 1 month of age despite the excision of the Ndel1 LoxP alleles at P15. B, Western blots showing levels of Ndel1 in the hippocampus and cortex of WT (+/+) and Ndel1 CKO (−/−) mice and summary bar graph data. Arbitrary levels of Ndel1 in the hippocampus: WT (+/+): 1.00 ± 0.06 versus Ndel1 CKO (−/−): 0.27 ± 0.11; mean ± SD (n = 3 animals). ***p < 0.001 (Student's t test). Arbitrary levels of Ndel1 in the cortex: WT (+/+): 1.00 ± 0.17 versus Ndel1 CKO (−/−): 0.27 ± 0.12; mean ± SD (n = 3 animals). ***p < 0.005 (Student's t test). C, CA1 pyramidal bilayer in dorsal hippocampus and enlarged ventricles in 7-week-old Ndel1 CKO brain (sections stained with H&E). D, E, Bilayer of CA1 pyramidal neurons in the dorsal hippocampus of 10-week-old Ndel1 CKO brain as detected by staining with (D) the neuronal marker NeuN and (E) the CA1 pyramidal neuron marker Wfs1, respectively. F, Serial sections of 7-week-old Ndel1 CKO brains stained with Wfs1 marker confirm the bilayer phenotype (from bregma ∼−1.7 mm to bregma ∼−2.7 mm). G, H, Time course analysis of CA1 anatomy reveals postnatal dispersion of principal cells. Dispersion of CA1 principal cells does not occur at P4 (LoxP-Ndel1 alleles not deleted). A few cells disperse at P17 in animals with the LoxP-Ndel1 alleles deleted (white asterisks). Dispersion is clearly evident at P32 and 51 when Ndel1 protein is significantly knocked down. Expression of Wfs1 that is associated with the endoplasmic reticulum and regulates calcium homeostasis is lower in P4 samples. Scale bars: D–F, 500 μm; G, 800 μm.
