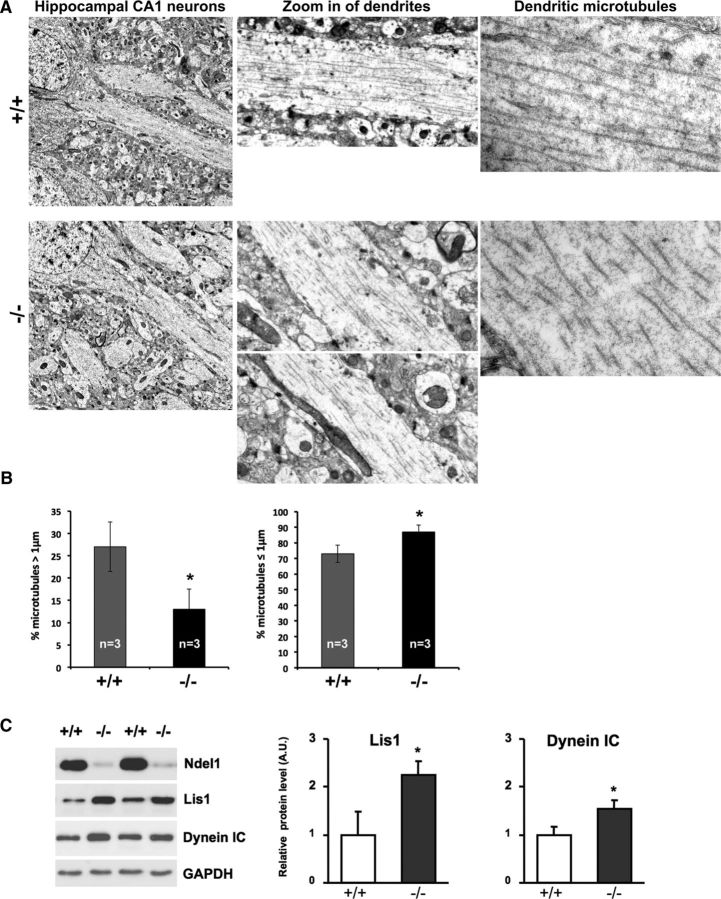
Figure 3.
CA1 pyramidal dendrites in Ndel1 CKO mice exhibit fragmented and shortened microtubules. A, Representative electron microscopic photographs of CA1 hippocampal dendrites from 9-week-old Ndel1 CKO mice and WT littermates. Note the fragmentation and shortening of dendritic microtubules in CA1 pyramidal cells from Ndel1 CKO versus WT mice. B, Bar graphs represent the percentage of microtubules longer, equal to, or shorter than 1 μm length in Ndel1 CKO (−/−) and WT mice (+/+). Percentage of microtubules >1 μm: WT: 27 ± 5.6% versus Ndel1 CKO: 13 ± 4.5%; mean ± SD (n = 3 animals). *p < 0.03. Percentage of microtubules ≤ 1 μm: WT: 73 ± 5.6% versus Ndel1 CKO: 87 ± 4.5%; mean ± SD (n = 3 animals). *p < 0.03. C, Levels of Lis1 and Dynein in hippocampus of Ndel1 CKO mice. Lis1 in WT: 1.00 ± 0.49 versus Ndel1 CKO: 2.25 ± 0.34; mean ± SE (n = 5 animals). *p < 0.05. Dynein: WT: 1.00 ± 0.16 versus Ndel1 CKO: 1.53 ± 0.19; mean ± SE (n = 5 animals). *p < 0.05. Student's t test was used for all statistical analyses in this figure.

