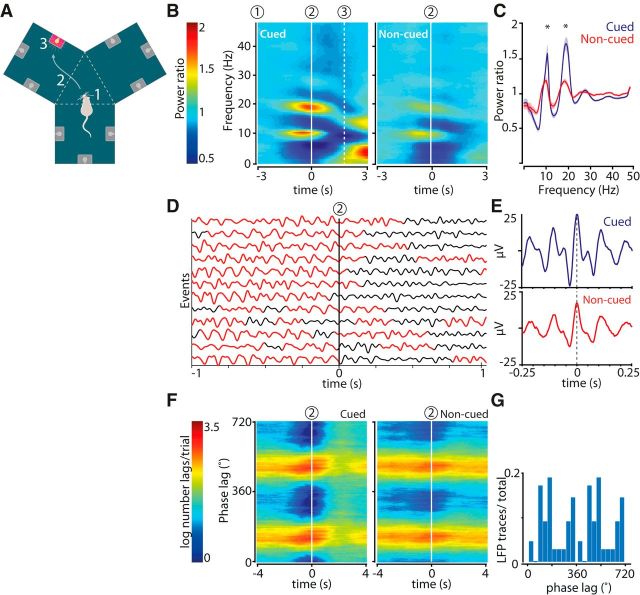
Figure 1.
Increased power in hippocampal LFPs in the theta and beta range during cued reward-site approach. A, Y-maze and behavioral task. Cued fluid well approaches were initiated on cue light illumination (1), and comprised chamber entry (2; dashed line) and nose poke in the fluid well associated with the lit cue light followed by reward delivery (3). Noncued approaches involved steps 2 and 3 in the absence of an illuminated cue light and were not rewarded. B, Color-coded power spectrograms averaged across all recording sessions and aligned to chamber entry (2; n = 23 sessions). Power ratio was computed by dividing the absolute power by baseline power (see Materials and Methods). C, Mean power distributions for cued (blue) and noncued (red) approaches calculated over a time window of 1 s centered at chamber entry. Shaded areas represent SEM. *p < 0.002 (WMPSR). D, Filtered (0–23 Hz) single LFP traces recorded from the hippocampal CA1 pyramidal layer aligned to cued chamber entries (2). Red represents time segments in which the beta band power exceeded 0.15 × maximum beta band power. Traces are a representative subsample from a single recording session. E, Mean of all raw LFP waveforms synchronized on theta peaks occurring between [−1,1] s relative to chamber entry events from the recording session shown in D. F, The phase lag between theta and beta band activity (ϕlag = ϕβ − 2 × ϕtheta) within an LFP trace was relatively stable around chamber entries (2) in cued and noncued conditions. G, Distribution of beta-to-theta phase lags for all hippocampal LFP traces (n = 115). In this case, the phase delay corresponds to the distance between the theta peak and the beta peak appearing as a “shoulder” (∼100°). The phase delay of the second beta peak cannot be dissociated from the theta peak (compare Figs. 4, 6).

